Slavic vs Immigrants from Kuwait Unemployment Among Ages 20 to 24 years
COMPARE
Slavic
Immigrants from Kuwait
Unemployment Among Ages 20 to 24 years
Unemployment Among Ages 20 to 24 years Comparison
Slavs
Immigrants from Kuwait
10.0%
UNEMPLOYMENT AMONG AGES 20 TO 24 YEARS
96.1/ 100
METRIC RATING
97th/ 347
METRIC RANK
9.8%
UNEMPLOYMENT AMONG AGES 20 TO 24 YEARS
99.5/ 100
METRIC RATING
60th/ 347
METRIC RANK
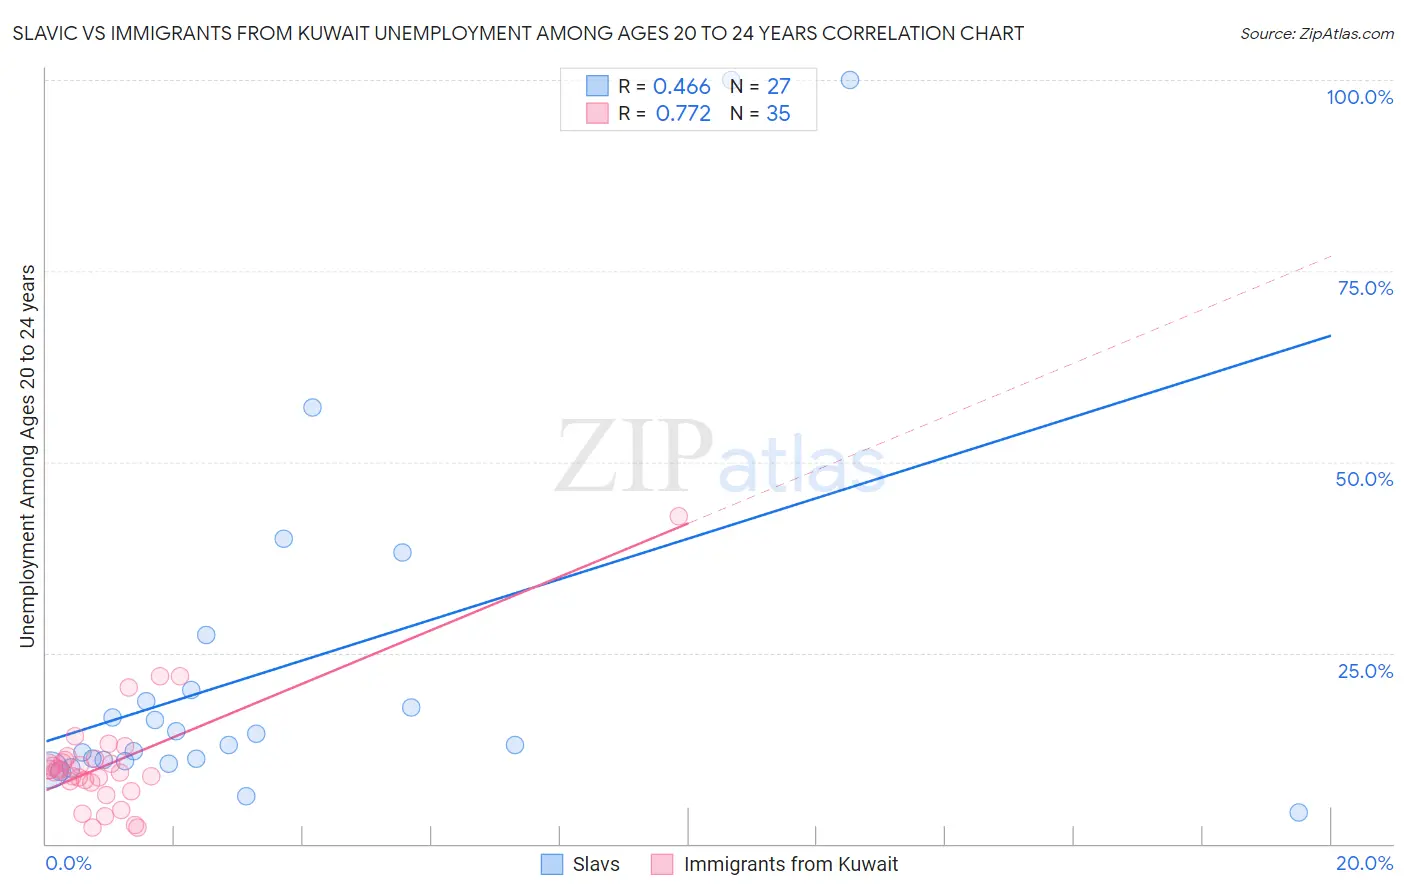
Slavic vs Immigrants from Kuwait Unemployment Among Ages 20 to 24 years Correlation Chart
The statistical analysis conducted on geographies consisting of 263,648,078 people shows a moderate positive correlation between the proportion of Slavs and unemployment rate among population between the ages 20 and 24 in the United States with a correlation coefficient (R) of 0.466 and weighted average of 10.0%. Similarly, the statistical analysis conducted on geographies consisting of 136,200,648 people shows a strong positive correlation between the proportion of Immigrants from Kuwait and unemployment rate among population between the ages 20 and 24 in the United States with a correlation coefficient (R) of 0.772 and weighted average of 9.8%, a difference of 1.9%.
Unemployment Among Ages 20 to 24 years Correlation Summary
| Measurement | Slavic | Immigrants from Kuwait |
| Minimum | 4.1% | 2.1% |
| Maximum | 100.0% | 42.8% |
| Range | 95.9% | 40.7% |
| Mean | 23.1% | 10.6% |
| Median | 13.0% | 9.7% |
| Interquartile 25% (IQ1) | 10.8% | 8.1% |
| Interquartile 75% (IQ3) | 20.2% | 11.2% |
| Interquartile Range (IQR) | 9.4% | 3.1% |
| Standard Deviation (Sample) | 24.9% | 7.3% |
| Standard Deviation (Population) | 24.5% | 7.2% |
Similar Demographics by Unemployment Among Ages 20 to 24 years
Demographics Similar to Slavs by Unemployment Among Ages 20 to 24 years
In terms of unemployment among ages 20 to 24 years, the demographic groups most similar to Slavs are Scotch-Irish (10.0%, a difference of 0.040%), Thai (10.0%, a difference of 0.040%), Immigrants from Micronesia (10.0%, a difference of 0.15%), Japanese (10.0%, a difference of 0.16%), and Fijian (10.0%, a difference of 0.17%).
| Demographics | Rating | Rank | Unemployment Among Ages 20 to 24 years |
| Chileans | 97.0 /100 | #90 | Exceptional 10.0% |
| Bhutanese | 96.9 /100 | #91 | Exceptional 10.0% |
| Bangladeshis | 96.9 /100 | #92 | Exceptional 10.0% |
| Immigrants | Malaysia | 96.9 /100 | #93 | Exceptional 10.0% |
| Immigrants | Micronesia | 96.6 /100 | #94 | Exceptional 10.0% |
| Scotch-Irish | 96.2 /100 | #95 | Exceptional 10.0% |
| Thais | 96.2 /100 | #96 | Exceptional 10.0% |
| Slavs | 96.1 /100 | #97 | Exceptional 10.0% |
| Japanese | 95.4 /100 | #98 | Exceptional 10.0% |
| Fijians | 95.3 /100 | #99 | Exceptional 10.0% |
| Immigrants | France | 95.2 /100 | #100 | Exceptional 10.0% |
| Laotians | 95.1 /100 | #101 | Exceptional 10.0% |
| Immigrants | Argentina | 94.9 /100 | #102 | Exceptional 10.0% |
| Irish | 94.3 /100 | #103 | Exceptional 10.0% |
| Immigrants | Chile | 94.0 /100 | #104 | Exceptional 10.0% |
Demographics Similar to Immigrants from Kuwait by Unemployment Among Ages 20 to 24 years
In terms of unemployment among ages 20 to 24 years, the demographic groups most similar to Immigrants from Kuwait are Malaysian (9.8%, a difference of 0.020%), Pakistani (9.8%, a difference of 0.030%), English (9.8%, a difference of 0.030%), Immigrants from Moldova (9.8%, a difference of 0.080%), and Immigrants from Singapore (9.8%, a difference of 0.12%).
| Demographics | Rating | Rank | Unemployment Among Ages 20 to 24 years |
| Immigrants | Serbia | 99.6 /100 | #53 | Exceptional 9.8% |
| Immigrants | Cambodia | 99.6 /100 | #54 | Exceptional 9.8% |
| Carpatho Rusyns | 99.6 /100 | #55 | Exceptional 9.8% |
| Nicaraguans | 99.6 /100 | #56 | Exceptional 9.8% |
| Immigrants | Moldova | 99.5 /100 | #57 | Exceptional 9.8% |
| Pakistanis | 99.5 /100 | #58 | Exceptional 9.8% |
| English | 99.5 /100 | #59 | Exceptional 9.8% |
| Immigrants | Kuwait | 99.5 /100 | #60 | Exceptional 9.8% |
| Malaysians | 99.5 /100 | #61 | Exceptional 9.8% |
| Immigrants | Singapore | 99.4 /100 | #62 | Exceptional 9.8% |
| British | 99.4 /100 | #63 | Exceptional 9.8% |
| Serbians | 99.4 /100 | #64 | Exceptional 9.8% |
| Welsh | 99.3 /100 | #65 | Exceptional 9.8% |
| Scottish | 99.3 /100 | #66 | Exceptional 9.8% |
| Immigrants | Bolivia | 99.2 /100 | #67 | Exceptional 9.9% |