Slavic vs Immigrants from Yemen Master's Degree
COMPARE
Slavic
Immigrants from Yemen
Master's Degree
Master's Degree Comparison
Slavs
Immigrants from Yemen
15.5%
MASTER'S DEGREE
77.0/ 100
METRIC RATING
152nd/ 347
METRIC RANK
11.6%
MASTER'S DEGREE
0.1/ 100
METRIC RATING
297th/ 347
METRIC RANK
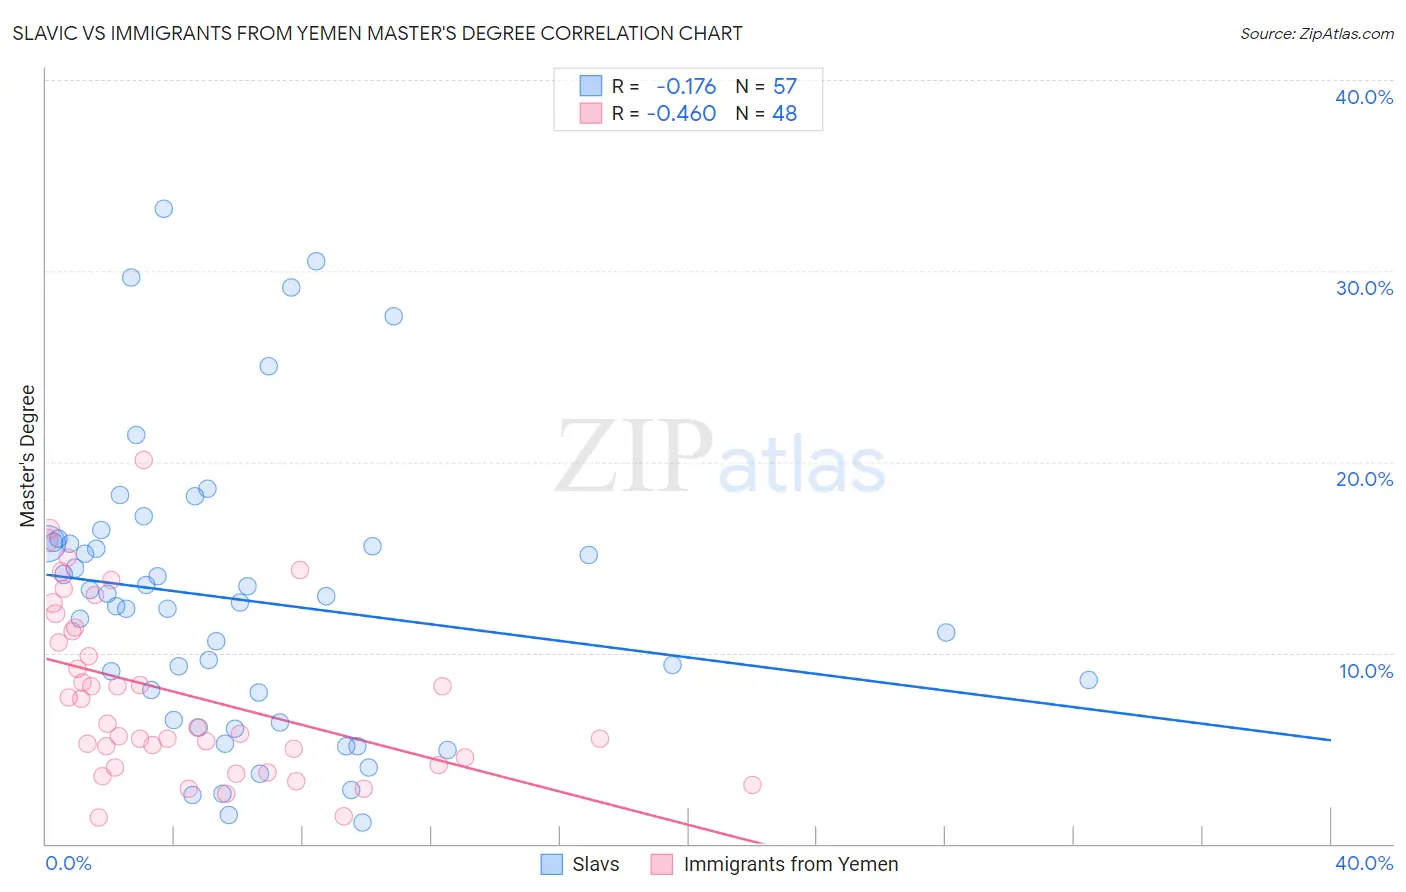
Slavic vs Immigrants from Yemen Master's Degree Correlation Chart
The statistical analysis conducted on geographies consisting of 270,833,952 people shows a poor negative correlation between the proportion of Slavs and percentage of population with at least master's degree education in the United States with a correlation coefficient (R) of -0.176 and weighted average of 15.5%. Similarly, the statistical analysis conducted on geographies consisting of 82,412,515 people shows a moderate negative correlation between the proportion of Immigrants from Yemen and percentage of population with at least master's degree education in the United States with a correlation coefficient (R) of -0.460 and weighted average of 11.6%, a difference of 34.1%.
Master's Degree Correlation Summary
| Measurement | Slavic | Immigrants from Yemen |
| Minimum | 1.1% | 1.3% |
| Maximum | 33.2% | 20.1% |
| Range | 32.1% | 18.7% |
| Mean | 12.8% | 7.8% |
| Median | 12.6% | 6.2% |
| Interquartile 25% (IQ1) | 6.4% | 4.3% |
| Interquartile 75% (IQ3) | 15.7% | 11.2% |
| Interquartile Range (IQR) | 9.3% | 6.9% |
| Standard Deviation (Sample) | 7.5% | 4.5% |
| Standard Deviation (Population) | 7.5% | 4.5% |
Similar Demographics by Master's Degree
Demographics Similar to Slavs by Master's Degree
In terms of master's degree, the demographic groups most similar to Slavs are Icelander (15.5%, a difference of 0.030%), Iraqi (15.5%, a difference of 0.050%), Immigrants from South America (15.5%, a difference of 0.12%), Immigrants from Bangladesh (15.5%, a difference of 0.16%), and Slovene (15.5%, a difference of 0.17%).
| Demographics | Rating | Rank | Master's Degree |
| South Americans | 81.3 /100 | #145 | Excellent 15.6% |
| Immigrants | Afghanistan | 79.4 /100 | #146 | Good 15.6% |
| Hungarians | 79.1 /100 | #147 | Good 15.6% |
| Immigrants | Senegal | 78.2 /100 | #148 | Good 15.5% |
| Ghanaians | 78.2 /100 | #149 | Good 15.5% |
| Slovenes | 78.0 /100 | #150 | Good 15.5% |
| Iraqis | 77.3 /100 | #151 | Good 15.5% |
| Slavs | 77.0 /100 | #152 | Good 15.5% |
| Icelanders | 76.8 /100 | #153 | Good 15.5% |
| Immigrants | South America | 76.3 /100 | #154 | Good 15.5% |
| Immigrants | Bangladesh | 76.1 /100 | #155 | Good 15.5% |
| Bermudans | 73.9 /100 | #156 | Good 15.4% |
| Immigrants | Cameroon | 71.7 /100 | #157 | Good 15.4% |
| Immigrants | Poland | 71.5 /100 | #158 | Good 15.4% |
| Luxembourgers | 71.0 /100 | #159 | Good 15.3% |
Demographics Similar to Immigrants from Yemen by Master's Degree
In terms of master's degree, the demographic groups most similar to Immigrants from Yemen are Alaskan Athabascan (11.6%, a difference of 0.12%), Marshallese (11.6%, a difference of 0.13%), Hawaiian (11.6%, a difference of 0.28%), Alaska Native (11.6%, a difference of 0.38%), and Immigrants from Guatemala (11.6%, a difference of 0.61%).
| Demographics | Rating | Rank | Master's Degree |
| Ute | 0.1 /100 | #290 | Tragic 11.7% |
| Colville | 0.1 /100 | #291 | Tragic 11.6% |
| Immigrants | Guatemala | 0.1 /100 | #292 | Tragic 11.6% |
| Alaska Natives | 0.1 /100 | #293 | Tragic 11.6% |
| Hawaiians | 0.1 /100 | #294 | Tragic 11.6% |
| Marshallese | 0.1 /100 | #295 | Tragic 11.6% |
| Alaskan Athabascans | 0.1 /100 | #296 | Tragic 11.6% |
| Immigrants | Yemen | 0.1 /100 | #297 | Tragic 11.6% |
| Samoans | 0.1 /100 | #298 | Tragic 11.5% |
| Chickasaw | 0.1 /100 | #299 | Tragic 11.4% |
| Chippewa | 0.1 /100 | #300 | Tragic 11.4% |
| Tsimshian | 0.1 /100 | #301 | Tragic 11.4% |
| Cherokee | 0.1 /100 | #302 | Tragic 11.4% |
| Immigrants | Laos | 0.1 /100 | #303 | Tragic 11.4% |
| Immigrants | Cabo Verde | 0.1 /100 | #304 | Tragic 11.3% |