Immigrants from Dominica vs Immigrants from Australia No Schooling Completed
COMPARE
Immigrants from Dominica
Immigrants from Australia
No Schooling Completed
No Schooling Completed Comparison
Immigrants from Dominica
Immigrants from Australia
2.8%
NO SCHOOLING COMPLETED
0.0/ 100
METRIC RATING
298th/ 347
METRIC RANK
1.7%
NO SCHOOLING COMPLETED
99.2/ 100
METRIC RATING
85th/ 347
METRIC RANK
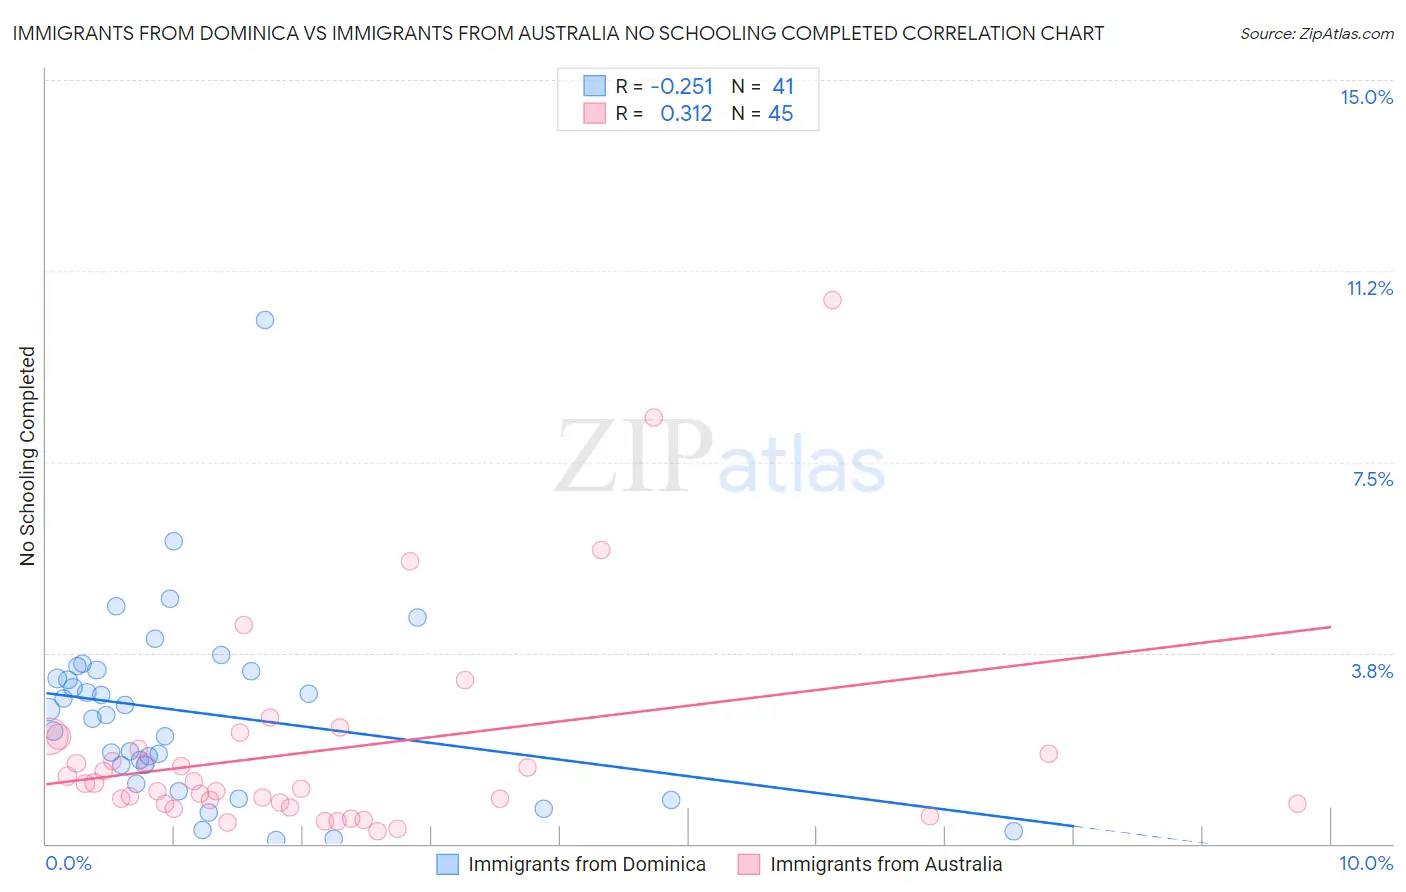
Immigrants from Dominica vs Immigrants from Australia No Schooling Completed Correlation Chart
The statistical analysis conducted on geographies consisting of 83,717,936 people shows a weak negative correlation between the proportion of Immigrants from Dominica and percentage of population with no schooling in the United States with a correlation coefficient (R) of -0.251 and weighted average of 2.8%. Similarly, the statistical analysis conducted on geographies consisting of 225,255,511 people shows a mild positive correlation between the proportion of Immigrants from Australia and percentage of population with no schooling in the United States with a correlation coefficient (R) of 0.312 and weighted average of 1.7%, a difference of 61.8%.
No Schooling Completed Correlation Summary
| Measurement | Immigrants from Dominica | Immigrants from Australia |
| Minimum | 0.065% | 0.24% |
| Maximum | 10.3% | 10.7% |
| Range | 10.2% | 10.4% |
| Mean | 2.6% | 1.8% |
| Median | 2.5% | 1.2% |
| Interquartile 25% (IQ1) | 1.4% | 0.79% |
| Interquartile 75% (IQ3) | 3.4% | 2.0% |
| Interquartile Range (IQR) | 2.0% | 1.2% |
| Standard Deviation (Sample) | 1.9% | 2.1% |
| Standard Deviation (Population) | 1.8% | 2.1% |
Similar Demographics by No Schooling Completed
Demographics Similar to Immigrants from Dominica by No Schooling Completed
In terms of no schooling completed, the demographic groups most similar to Immigrants from Dominica are Immigrants from Cuba (2.8%, a difference of 0.33%), Central American Indian (2.8%, a difference of 0.51%), Haitian (2.9%, a difference of 0.83%), Immigrants (2.8%, a difference of 1.5%), and Houma (2.8%, a difference of 1.6%).
| Demographics | Rating | Rank | No Schooling Completed |
| British West Indians | 0.0 /100 | #291 | Tragic 2.7% |
| Immigrants | Grenada | 0.0 /100 | #292 | Tragic 2.8% |
| Malaysians | 0.0 /100 | #293 | Tragic 2.8% |
| Immigrants | Eritrea | 0.0 /100 | #294 | Tragic 2.8% |
| Houma | 0.0 /100 | #295 | Tragic 2.8% |
| Immigrants | Immigrants | 0.0 /100 | #296 | Tragic 2.8% |
| Immigrants | Cuba | 0.0 /100 | #297 | Tragic 2.8% |
| Immigrants | Dominica | 0.0 /100 | #298 | Tragic 2.8% |
| Central American Indians | 0.0 /100 | #299 | Tragic 2.8% |
| Haitians | 0.0 /100 | #300 | Tragic 2.9% |
| Immigrants | South Eastern Asia | 0.0 /100 | #301 | Tragic 2.9% |
| Immigrants | Caribbean | 0.0 /100 | #302 | Tragic 2.9% |
| Somalis | 0.0 /100 | #303 | Tragic 2.9% |
| Nicaraguans | 0.0 /100 | #304 | Tragic 2.9% |
| Ecuadorians | 0.0 /100 | #305 | Tragic 3.0% |
Demographics Similar to Immigrants from Australia by No Schooling Completed
In terms of no schooling completed, the demographic groups most similar to Immigrants from Australia are Immigrants from Denmark (1.7%, a difference of 0.040%), Ukrainian (1.8%, a difference of 0.050%), Potawatomi (1.7%, a difference of 0.090%), Immigrants from South Africa (1.7%, a difference of 0.20%), and Icelander (1.7%, a difference of 0.29%).
| Demographics | Rating | Rank | No Schooling Completed |
| Delaware | 99.3 /100 | #78 | Exceptional 1.7% |
| Macedonians | 99.3 /100 | #79 | Exceptional 1.7% |
| Cypriots | 99.3 /100 | #80 | Exceptional 1.7% |
| Icelanders | 99.3 /100 | #81 | Exceptional 1.7% |
| Immigrants | South Africa | 99.3 /100 | #82 | Exceptional 1.7% |
| Potawatomi | 99.3 /100 | #83 | Exceptional 1.7% |
| Immigrants | Denmark | 99.2 /100 | #84 | Exceptional 1.7% |
| Immigrants | Australia | 99.2 /100 | #85 | Exceptional 1.7% |
| Ukrainians | 99.2 /100 | #86 | Exceptional 1.8% |
| Osage | 99.2 /100 | #87 | Exceptional 1.8% |
| Immigrants | Western Europe | 99.2 /100 | #88 | Exceptional 1.8% |
| South Africans | 99.1 /100 | #89 | Exceptional 1.8% |
| Sioux | 99.0 /100 | #90 | Exceptional 1.8% |
| Immigrants | Germany | 99.0 /100 | #91 | Exceptional 1.8% |
| Romanians | 98.8 /100 | #92 | Exceptional 1.8% |