Sioux vs Navajo 9th Grade
COMPARE
Sioux
Navajo
9th Grade
9th Grade Comparison
Sioux
Navajo
95.9%
9TH GRADE
99.8/ 100
METRIC RATING
61st/ 347
METRIC RANK
93.9%
9TH GRADE
0.3/ 100
METRIC RATING
266th/ 347
METRIC RANK
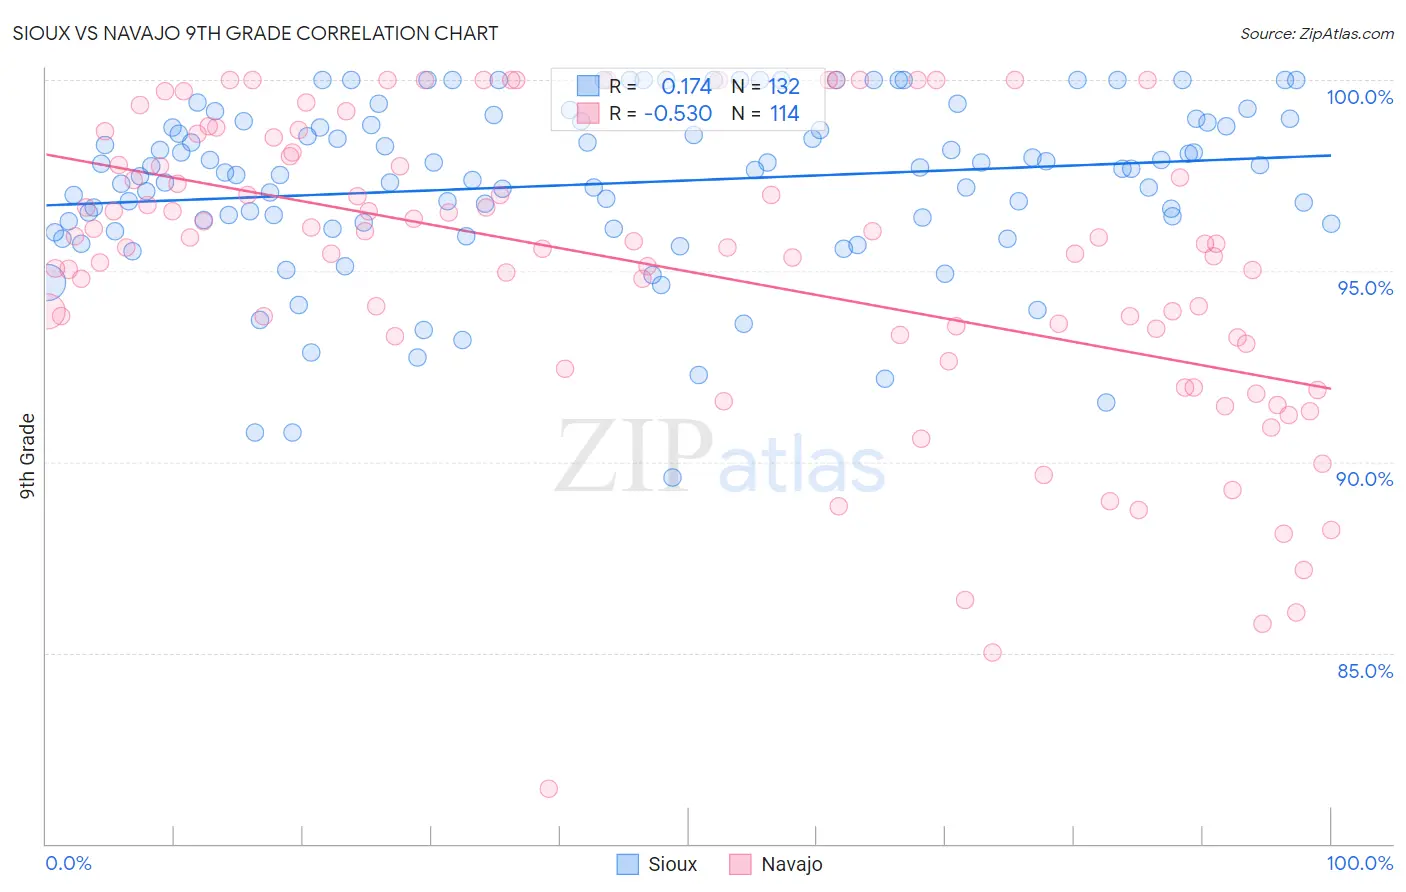
Sioux vs Navajo 9th Grade Correlation Chart
The statistical analysis conducted on geographies consisting of 234,196,827 people shows a poor positive correlation between the proportion of Sioux and percentage of population with at least 9th grade education in the United States with a correlation coefficient (R) of 0.174 and weighted average of 95.9%. Similarly, the statistical analysis conducted on geographies consisting of 224,872,587 people shows a substantial negative correlation between the proportion of Navajo and percentage of population with at least 9th grade education in the United States with a correlation coefficient (R) of -0.530 and weighted average of 93.9%, a difference of 2.2%.
9th Grade Correlation Summary
| Measurement | Sioux | Navajo |
| Minimum | 89.6% | 81.4% |
| Maximum | 100.0% | 100.0% |
| Range | 10.4% | 18.6% |
| Mean | 97.3% | 95.1% |
| Median | 97.7% | 95.7% |
| Interquartile 25% (IQ1) | 96.3% | 93.2% |
| Interquartile 75% (IQ3) | 98.9% | 98.0% |
| Interquartile Range (IQR) | 2.6% | 4.8% |
| Standard Deviation (Sample) | 2.2% | 3.9% |
| Standard Deviation (Population) | 2.2% | 3.9% |
Similar Demographics by 9th Grade
Demographics Similar to Sioux by 9th Grade
In terms of 9th grade, the demographic groups most similar to Sioux are Native Hawaiian (95.9%, a difference of 0.010%), Ukrainian (95.9%, a difference of 0.010%), New Zealander (95.9%, a difference of 0.030%), Aleut (96.0%, a difference of 0.040%), and Macedonian (96.0%, a difference of 0.050%).
| Demographics | Rating | Rank | 9th Grade |
| Immigrants | Canada | 99.8 /100 | #54 | Exceptional 96.0% |
| Immigrants | Austria | 99.8 /100 | #55 | Exceptional 96.0% |
| Immigrants | North America | 99.8 /100 | #56 | Exceptional 96.0% |
| Macedonians | 99.8 /100 | #57 | Exceptional 96.0% |
| Aleuts | 99.8 /100 | #58 | Exceptional 96.0% |
| New Zealanders | 99.8 /100 | #59 | Exceptional 95.9% |
| Native Hawaiians | 99.8 /100 | #60 | Exceptional 95.9% |
| Sioux | 99.8 /100 | #61 | Exceptional 95.9% |
| Ukrainians | 99.7 /100 | #62 | Exceptional 95.9% |
| Canadians | 99.7 /100 | #63 | Exceptional 95.9% |
| Zimbabweans | 99.7 /100 | #64 | Exceptional 95.9% |
| Immigrants | England | 99.6 /100 | #65 | Exceptional 95.9% |
| Immigrants | Netherlands | 99.6 /100 | #66 | Exceptional 95.8% |
| Cypriots | 99.6 /100 | #67 | Exceptional 95.8% |
| Immigrants | Ireland | 99.6 /100 | #68 | Exceptional 95.8% |
Demographics Similar to Navajo by 9th Grade
In terms of 9th grade, the demographic groups most similar to Navajo are Immigrants from Congo (93.9%, a difference of 0.010%), Native/Alaskan (93.9%, a difference of 0.010%), Immigrants from Jamaica (93.9%, a difference of 0.020%), Immigrants from Uzbekistan (93.9%, a difference of 0.020%), and Armenian (93.9%, a difference of 0.020%).
| Demographics | Rating | Rank | 9th Grade |
| Ghanaians | 0.5 /100 | #259 | Tragic 93.9% |
| Pima | 0.4 /100 | #260 | Tragic 93.9% |
| South Americans | 0.4 /100 | #261 | Tragic 93.9% |
| Immigrants | Jamaica | 0.4 /100 | #262 | Tragic 93.9% |
| Immigrants | Uzbekistan | 0.4 /100 | #263 | Tragic 93.9% |
| Immigrants | Congo | 0.4 /100 | #264 | Tragic 93.9% |
| Natives/Alaskans | 0.4 /100 | #265 | Tragic 93.9% |
| Navajo | 0.3 /100 | #266 | Tragic 93.9% |
| Armenians | 0.3 /100 | #267 | Tragic 93.9% |
| Immigrants | Bolivia | 0.3 /100 | #268 | Tragic 93.9% |
| Immigrants | Uruguay | 0.2 /100 | #269 | Tragic 93.8% |
| Yuman | 0.2 /100 | #270 | Tragic 93.8% |
| Immigrants | Ghana | 0.2 /100 | #271 | Tragic 93.8% |
| Immigrants | Western Africa | 0.2 /100 | #272 | Tragic 93.8% |
| Immigrants | South America | 0.2 /100 | #273 | Tragic 93.8% |