Immigrants from Dominica vs Navajo 9th Grade
COMPARE
Immigrants from Dominica
Navajo
9th Grade
9th Grade Comparison
Immigrants from Dominica
Navajo
92.7%
9TH GRADE
0.0/ 100
METRIC RATING
302nd/ 347
METRIC RANK
93.9%
9TH GRADE
0.3/ 100
METRIC RATING
266th/ 347
METRIC RANK
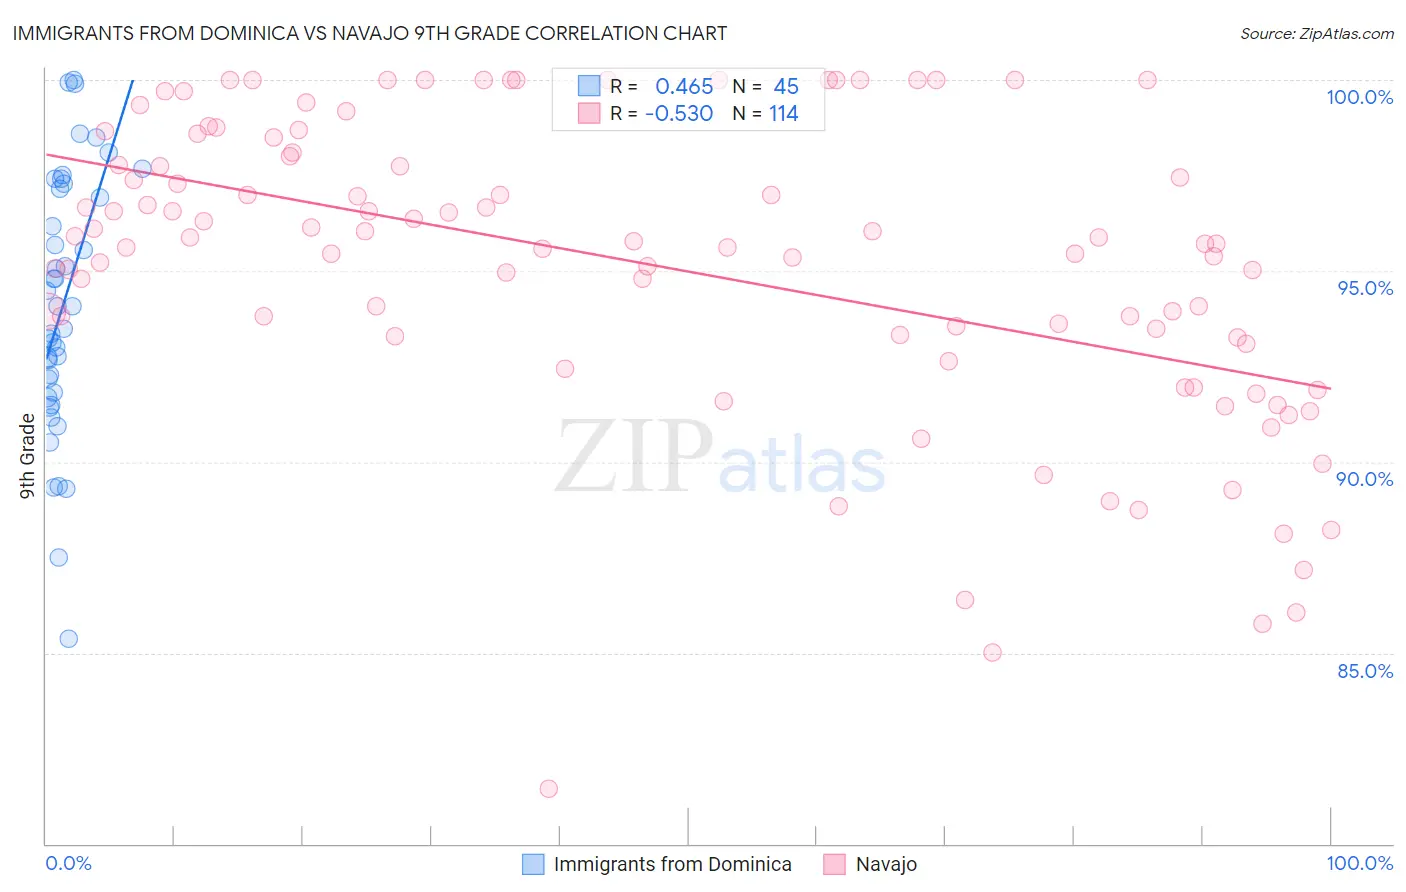
Immigrants from Dominica vs Navajo 9th Grade Correlation Chart
The statistical analysis conducted on geographies consisting of 83,794,115 people shows a moderate positive correlation between the proportion of Immigrants from Dominica and percentage of population with at least 9th grade education in the United States with a correlation coefficient (R) of 0.465 and weighted average of 92.7%. Similarly, the statistical analysis conducted on geographies consisting of 224,872,587 people shows a substantial negative correlation between the proportion of Navajo and percentage of population with at least 9th grade education in the United States with a correlation coefficient (R) of -0.530 and weighted average of 93.9%, a difference of 1.3%.
9th Grade Correlation Summary
| Measurement | Immigrants from Dominica | Navajo |
| Minimum | 85.4% | 81.4% |
| Maximum | 100.0% | 100.0% |
| Range | 14.6% | 18.6% |
| Mean | 94.1% | 95.1% |
| Median | 94.1% | 95.7% |
| Interquartile 25% (IQ1) | 91.7% | 93.2% |
| Interquartile 75% (IQ3) | 97.2% | 98.0% |
| Interquartile Range (IQR) | 5.5% | 4.8% |
| Standard Deviation (Sample) | 3.4% | 3.9% |
| Standard Deviation (Population) | 3.4% | 3.9% |
Similar Demographics by 9th Grade
Demographics Similar to Immigrants from Dominica by 9th Grade
In terms of 9th grade, the demographic groups most similar to Immigrants from Dominica are Guyanese (92.7%, a difference of 0.020%), Tohono O'odham (92.6%, a difference of 0.040%), Japanese (92.6%, a difference of 0.060%), Immigrants from Vietnam (92.6%, a difference of 0.060%), and Immigrants from Haiti (92.7%, a difference of 0.080%).
| Demographics | Rating | Rank | 9th Grade |
| Immigrants | Burma/Myanmar | 0.0 /100 | #295 | Tragic 93.1% |
| Indonesians | 0.0 /100 | #296 | Tragic 93.1% |
| Fijians | 0.0 /100 | #297 | Tragic 93.1% |
| Haitians | 0.0 /100 | #298 | Tragic 93.1% |
| Immigrants | Grenada | 0.0 /100 | #299 | Tragic 93.0% |
| Yaqui | 0.0 /100 | #300 | Tragic 92.9% |
| Immigrants | Haiti | 0.0 /100 | #301 | Tragic 92.7% |
| Immigrants | Dominica | 0.0 /100 | #302 | Tragic 92.7% |
| Guyanese | 0.0 /100 | #303 | Tragic 92.7% |
| Tohono O'odham | 0.0 /100 | #304 | Tragic 92.6% |
| Japanese | 0.0 /100 | #305 | Tragic 92.6% |
| Immigrants | Vietnam | 0.0 /100 | #306 | Tragic 92.6% |
| Immigrants | Immigrants | 0.0 /100 | #307 | Tragic 92.5% |
| Immigrants | Guyana | 0.0 /100 | #308 | Tragic 92.5% |
| Immigrants | Bangladesh | 0.0 /100 | #309 | Tragic 92.4% |
Demographics Similar to Navajo by 9th Grade
In terms of 9th grade, the demographic groups most similar to Navajo are Immigrants from Congo (93.9%, a difference of 0.010%), Native/Alaskan (93.9%, a difference of 0.010%), Immigrants from Jamaica (93.9%, a difference of 0.020%), Immigrants from Uzbekistan (93.9%, a difference of 0.020%), and Armenian (93.9%, a difference of 0.020%).
| Demographics | Rating | Rank | 9th Grade |
| Ghanaians | 0.5 /100 | #259 | Tragic 93.9% |
| Pima | 0.4 /100 | #260 | Tragic 93.9% |
| South Americans | 0.4 /100 | #261 | Tragic 93.9% |
| Immigrants | Jamaica | 0.4 /100 | #262 | Tragic 93.9% |
| Immigrants | Uzbekistan | 0.4 /100 | #263 | Tragic 93.9% |
| Immigrants | Congo | 0.4 /100 | #264 | Tragic 93.9% |
| Natives/Alaskans | 0.4 /100 | #265 | Tragic 93.9% |
| Navajo | 0.3 /100 | #266 | Tragic 93.9% |
| Armenians | 0.3 /100 | #267 | Tragic 93.9% |
| Immigrants | Bolivia | 0.3 /100 | #268 | Tragic 93.9% |
| Immigrants | Uruguay | 0.2 /100 | #269 | Tragic 93.8% |
| Yuman | 0.2 /100 | #270 | Tragic 93.8% |
| Immigrants | Ghana | 0.2 /100 | #271 | Tragic 93.8% |
| Immigrants | Western Africa | 0.2 /100 | #272 | Tragic 93.8% |
| Immigrants | South America | 0.2 /100 | #273 | Tragic 93.8% |