Sioux vs Czechoslovakian 9th Grade
COMPARE
Sioux
Czechoslovakian
9th Grade
9th Grade Comparison
Sioux
Czechoslovakians
95.9%
9TH GRADE
99.8/ 100
METRIC RATING
61st/ 347
METRIC RANK
96.1%
9TH GRADE
99.9/ 100
METRIC RATING
41st/ 347
METRIC RANK
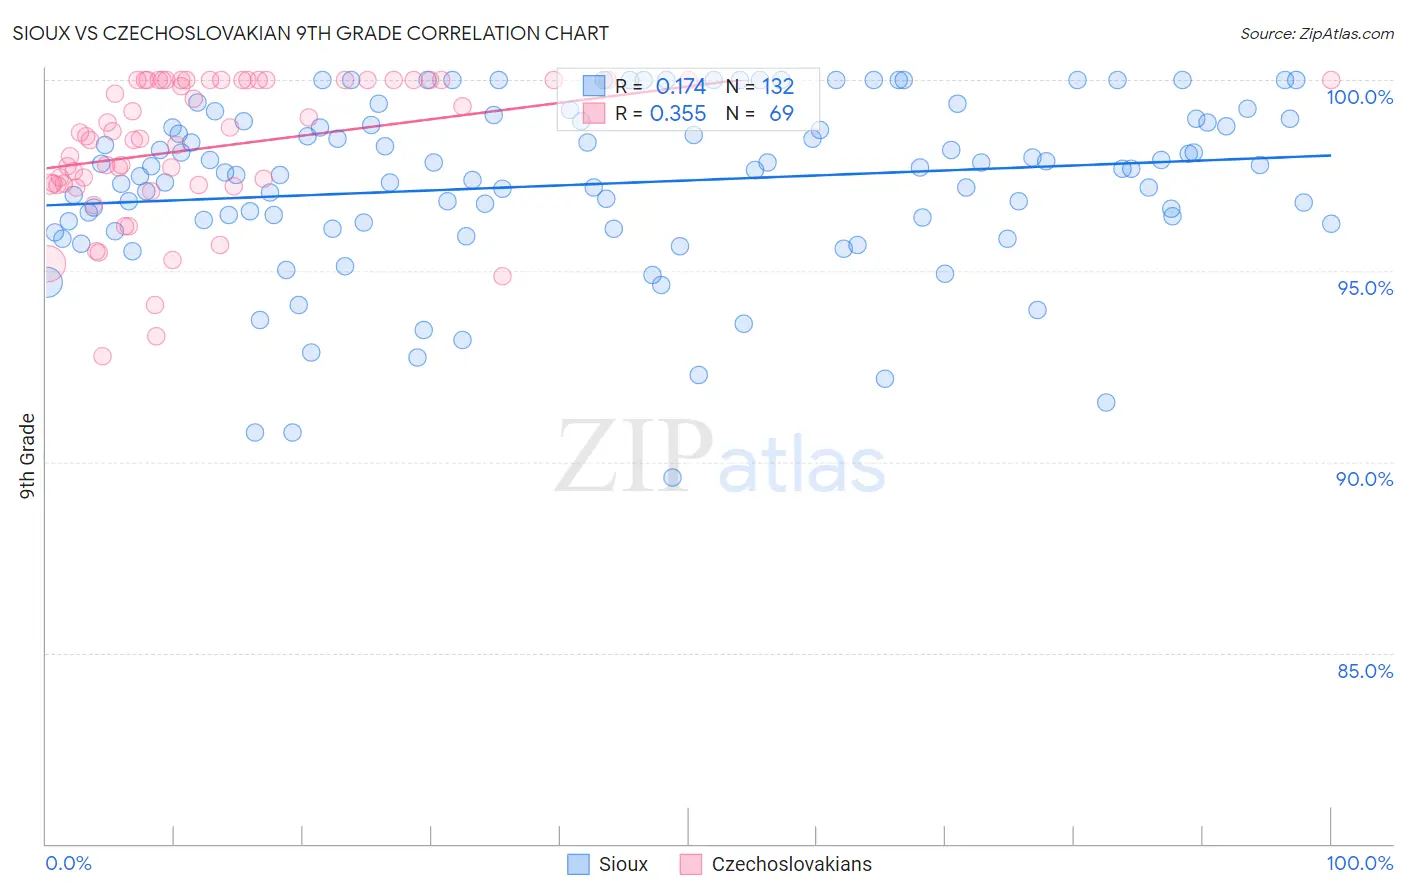
Sioux vs Czechoslovakian 9th Grade Correlation Chart
The statistical analysis conducted on geographies consisting of 234,196,827 people shows a poor positive correlation between the proportion of Sioux and percentage of population with at least 9th grade education in the United States with a correlation coefficient (R) of 0.174 and weighted average of 95.9%. Similarly, the statistical analysis conducted on geographies consisting of 368,668,876 people shows a mild positive correlation between the proportion of Czechoslovakians and percentage of population with at least 9th grade education in the United States with a correlation coefficient (R) of 0.355 and weighted average of 96.1%, a difference of 0.18%.
9th Grade Correlation Summary
| Measurement | Sioux | Czechoslovakian |
| Minimum | 89.6% | 92.8% |
| Maximum | 100.0% | 100.0% |
| Range | 10.4% | 7.2% |
| Mean | 97.3% | 98.2% |
| Median | 97.7% | 98.5% |
| Interquartile 25% (IQ1) | 96.3% | 97.3% |
| Interquartile 75% (IQ3) | 98.9% | 100.0% |
| Interquartile Range (IQR) | 2.6% | 2.7% |
| Standard Deviation (Sample) | 2.2% | 1.8% |
| Standard Deviation (Population) | 2.2% | 1.8% |
Demographics Similar to Sioux and Czechoslovakians by 9th Grade
In terms of 9th grade, the demographic groups most similar to Sioux are Native Hawaiian (95.9%, a difference of 0.010%), New Zealander (95.9%, a difference of 0.030%), Aleut (96.0%, a difference of 0.040%), Macedonian (96.0%, a difference of 0.050%), and Immigrants from Austria (96.0%, a difference of 0.060%). Similarly, the demographic groups most similar to Czechoslovakians are Chippewa (96.1%, a difference of 0.0%), Iranian (96.1%, a difference of 0.010%), Alaska Native (96.1%, a difference of 0.030%), Crow (96.1%, a difference of 0.030%), and Immigrants from India (96.1%, a difference of 0.040%).
| Demographics | Rating | Rank | 9th Grade |
| Czechoslovakians | 99.9 /100 | #41 | Exceptional 96.1% |
| Chippewa | 99.9 /100 | #42 | Exceptional 96.1% |
| Iranians | 99.9 /100 | #43 | Exceptional 96.1% |
| Alaska Natives | 99.9 /100 | #44 | Exceptional 96.1% |
| Crow | 99.9 /100 | #45 | Exceptional 96.1% |
| Immigrants | India | 99.9 /100 | #46 | Exceptional 96.1% |
| Russians | 99.9 /100 | #47 | Exceptional 96.0% |
| Australians | 99.9 /100 | #48 | Exceptional 96.0% |
| Greeks | 99.9 /100 | #49 | Exceptional 96.0% |
| Celtics | 99.9 /100 | #50 | Exceptional 96.0% |
| Immigrants | Northern Europe | 99.9 /100 | #51 | Exceptional 96.0% |
| Serbians | 99.9 /100 | #52 | Exceptional 96.0% |
| Austrians | 99.8 /100 | #53 | Exceptional 96.0% |
| Immigrants | Canada | 99.8 /100 | #54 | Exceptional 96.0% |
| Immigrants | Austria | 99.8 /100 | #55 | Exceptional 96.0% |
| Immigrants | North America | 99.8 /100 | #56 | Exceptional 96.0% |
| Macedonians | 99.8 /100 | #57 | Exceptional 96.0% |
| Aleuts | 99.8 /100 | #58 | Exceptional 96.0% |
| New Zealanders | 99.8 /100 | #59 | Exceptional 95.9% |
| Native Hawaiians | 99.8 /100 | #60 | Exceptional 95.9% |
| Sioux | 99.8 /100 | #61 | Exceptional 95.9% |