Sioux vs French Canadian Master's Degree
COMPARE
Sioux
French Canadian
Master's Degree
Master's Degree Comparison
Sioux
French Canadians
10.7%
MASTER'S DEGREE
0.0/ 100
METRIC RATING
322nd/ 347
METRIC RANK
14.1%
MASTER'S DEGREE
14.9/ 100
METRIC RATING
218th/ 347
METRIC RANK
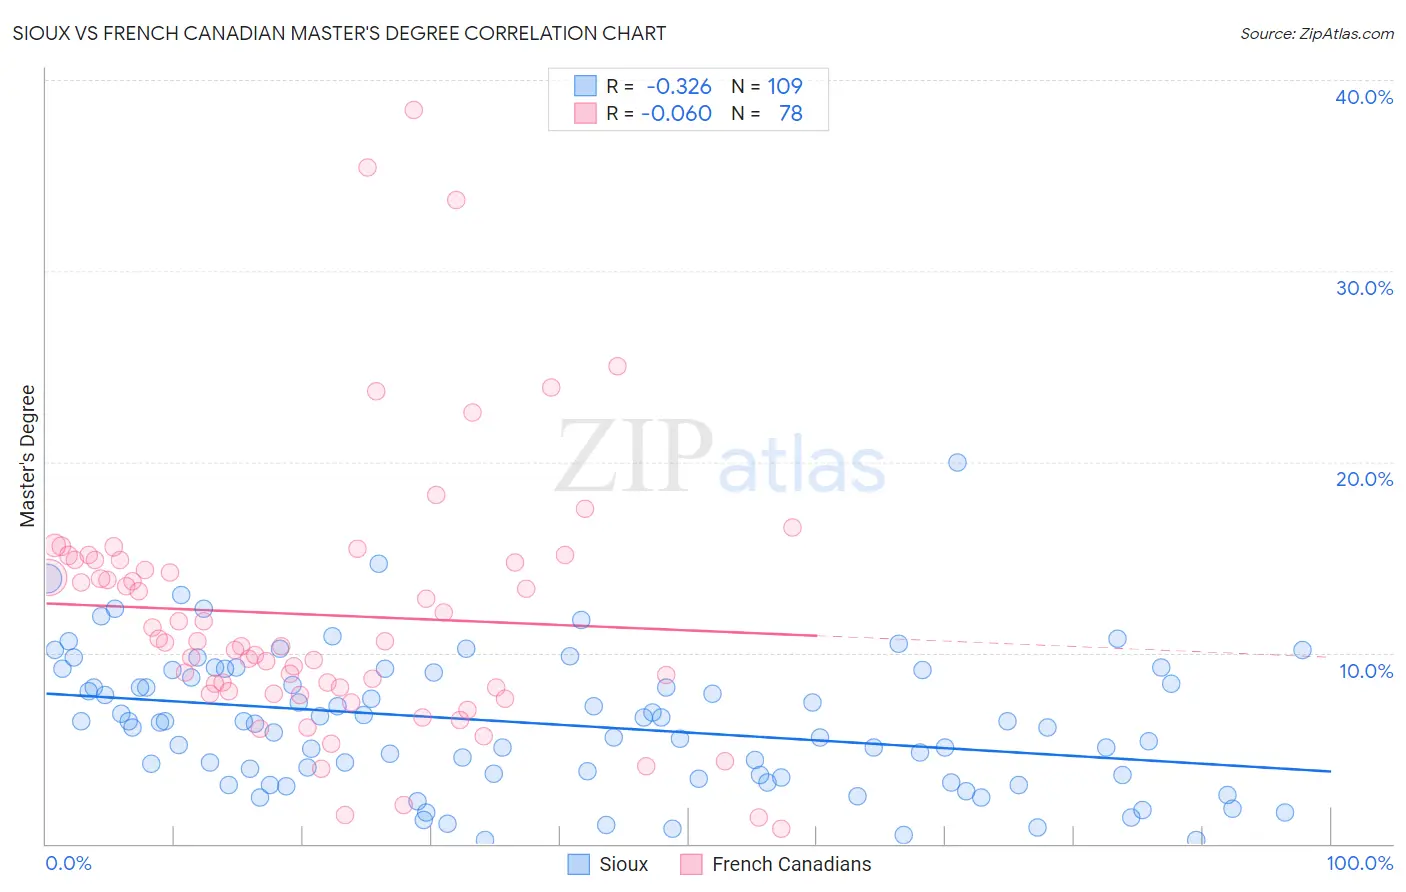
Sioux vs French Canadian Master's Degree Correlation Chart
The statistical analysis conducted on geographies consisting of 234,105,969 people shows a mild negative correlation between the proportion of Sioux and percentage of population with at least master's degree education in the United States with a correlation coefficient (R) of -0.326 and weighted average of 10.7%. Similarly, the statistical analysis conducted on geographies consisting of 502,359,495 people shows a slight negative correlation between the proportion of French Canadians and percentage of population with at least master's degree education in the United States with a correlation coefficient (R) of -0.060 and weighted average of 14.1%, a difference of 32.0%.
Master's Degree Correlation Summary
| Measurement | Sioux | French Canadian |
| Minimum | 0.18% | 0.81% |
| Maximum | 20.0% | 38.5% |
| Range | 19.8% | 37.6% |
| Mean | 6.3% | 12.0% |
| Median | 6.4% | 10.6% |
| Interquartile 25% (IQ1) | 3.5% | 8.0% |
| Interquartile 75% (IQ3) | 9.0% | 14.9% |
| Interquartile Range (IQR) | 5.5% | 6.9% |
| Standard Deviation (Sample) | 3.6% | 6.9% |
| Standard Deviation (Population) | 3.6% | 6.9% |
Similar Demographics by Master's Degree
Demographics Similar to Sioux by Master's Degree
In terms of master's degree, the demographic groups most similar to Sioux are Crow (10.6%, a difference of 0.39%), Dutch West Indian (10.6%, a difference of 0.44%), Pennsylvania German (10.7%, a difference of 0.64%), Immigrants from Micronesia (10.8%, a difference of 0.85%), and Kiowa (10.8%, a difference of 1.5%).
| Demographics | Rating | Rank | Master's Degree |
| Apache | 0.0 /100 | #315 | Tragic 11.0% |
| Hispanics or Latinos | 0.0 /100 | #316 | Tragic 10.9% |
| Hopi | 0.0 /100 | #317 | Tragic 10.9% |
| Immigrants | Cuba | 0.0 /100 | #318 | Tragic 10.9% |
| Kiowa | 0.0 /100 | #319 | Tragic 10.8% |
| Immigrants | Micronesia | 0.0 /100 | #320 | Tragic 10.8% |
| Pennsylvania Germans | 0.0 /100 | #321 | Tragic 10.7% |
| Sioux | 0.0 /100 | #322 | Tragic 10.7% |
| Crow | 0.0 /100 | #323 | Tragic 10.6% |
| Dutch West Indians | 0.0 /100 | #324 | Tragic 10.6% |
| Inupiat | 0.0 /100 | #325 | Tragic 10.5% |
| Creek | 0.0 /100 | #326 | Tragic 10.5% |
| Paiute | 0.0 /100 | #327 | Tragic 10.5% |
| Bangladeshis | 0.0 /100 | #328 | Tragic 10.5% |
| Nepalese | 0.0 /100 | #329 | Tragic 10.5% |
Demographics Similar to French Canadians by Master's Degree
In terms of master's degree, the demographic groups most similar to French Canadians are Immigrants from Somalia (14.1%, a difference of 0.25%), Immigrants from Trinidad and Tobago (14.1%, a difference of 0.25%), Immigrants from Vietnam (14.1%, a difference of 0.32%), Norwegian (14.0%, a difference of 0.35%), and German (14.0%, a difference of 0.50%).
| Demographics | Rating | Rank | Master's Degree |
| Somalis | 18.0 /100 | #211 | Poor 14.2% |
| Spanish | 17.8 /100 | #212 | Poor 14.2% |
| Immigrants | Thailand | 17.0 /100 | #213 | Poor 14.2% |
| Finns | 16.9 /100 | #214 | Poor 14.2% |
| Immigrants | Vietnam | 16.1 /100 | #215 | Poor 14.1% |
| Immigrants | Somalia | 15.8 /100 | #216 | Poor 14.1% |
| Immigrants | Trinidad and Tobago | 15.8 /100 | #217 | Poor 14.1% |
| French Canadians | 14.9 /100 | #218 | Poor 14.1% |
| Norwegians | 13.6 /100 | #219 | Poor 14.0% |
| Germans | 13.1 /100 | #220 | Poor 14.0% |
| Koreans | 12.7 /100 | #221 | Poor 14.0% |
| Ecuadorians | 12.6 /100 | #222 | Poor 14.0% |
| Immigrants | South Eastern Asia | 11.9 /100 | #223 | Poor 14.0% |
| Immigrants | Grenada | 11.8 /100 | #224 | Poor 14.0% |
| Portuguese | 11.2 /100 | #225 | Poor 13.9% |