Sioux vs Immigrants from Zimbabwe Master's Degree
COMPARE
Sioux
Immigrants from Zimbabwe
Master's Degree
Master's Degree Comparison
Sioux
Immigrants from Zimbabwe
10.7%
MASTER'S DEGREE
0.0/ 100
METRIC RATING
322nd/ 347
METRIC RANK
17.4%
MASTER'S DEGREE
99.5/ 100
METRIC RATING
83rd/ 347
METRIC RANK
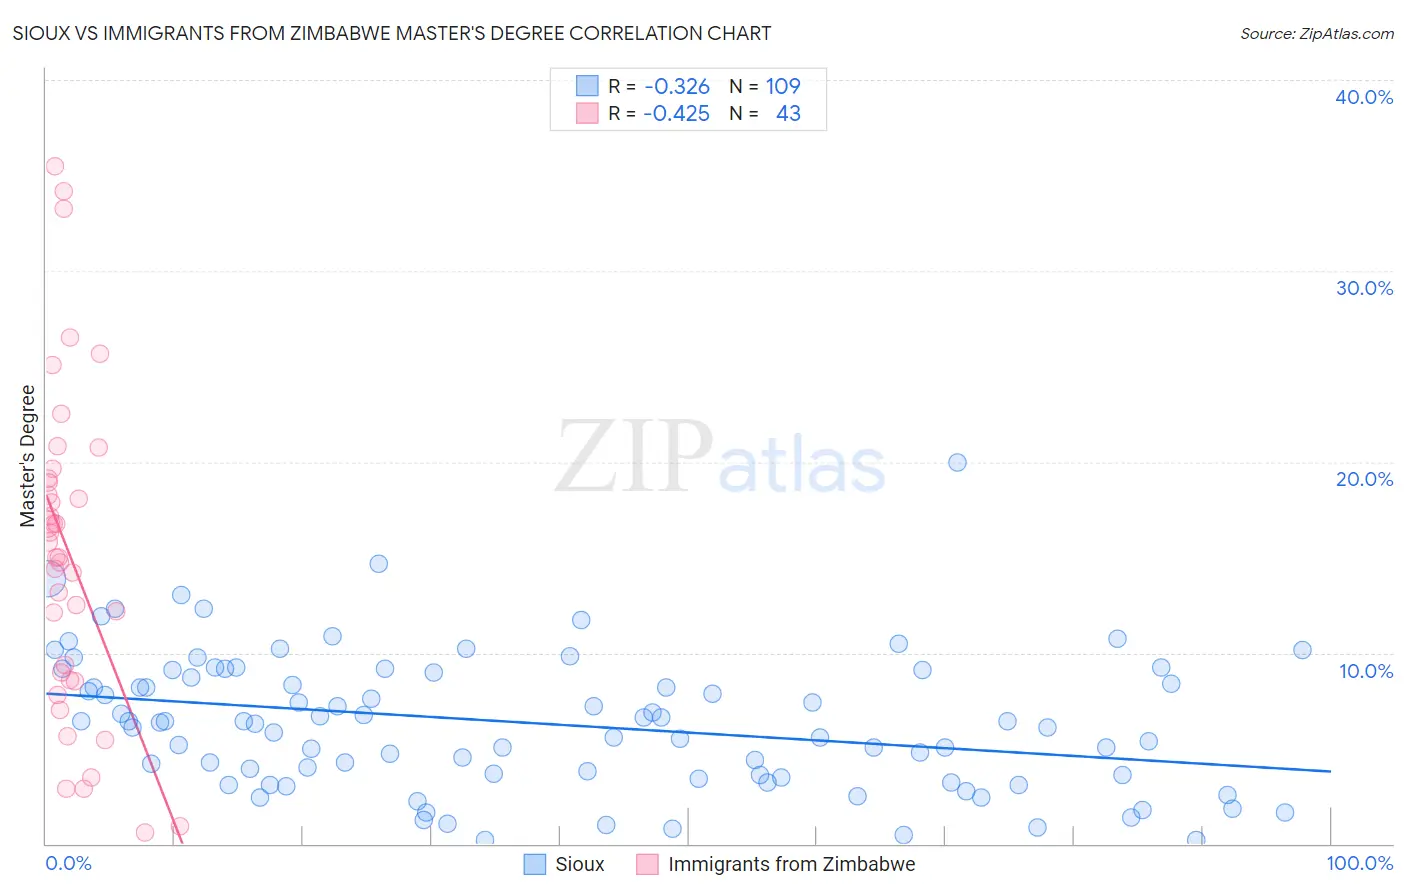
Sioux vs Immigrants from Zimbabwe Master's Degree Correlation Chart
The statistical analysis conducted on geographies consisting of 234,105,969 people shows a mild negative correlation between the proportion of Sioux and percentage of population with at least master's degree education in the United States with a correlation coefficient (R) of -0.326 and weighted average of 10.7%. Similarly, the statistical analysis conducted on geographies consisting of 117,807,833 people shows a moderate negative correlation between the proportion of Immigrants from Zimbabwe and percentage of population with at least master's degree education in the United States with a correlation coefficient (R) of -0.425 and weighted average of 17.4%, a difference of 63.4%.
Master's Degree Correlation Summary
| Measurement | Sioux | Immigrants from Zimbabwe |
| Minimum | 0.18% | 0.61% |
| Maximum | 20.0% | 35.5% |
| Range | 19.8% | 34.9% |
| Mean | 6.3% | 15.1% |
| Median | 6.4% | 15.0% |
| Interquartile 25% (IQ1) | 3.5% | 8.6% |
| Interquartile 75% (IQ3) | 9.0% | 19.1% |
| Interquartile Range (IQR) | 5.5% | 10.5% |
| Standard Deviation (Sample) | 3.6% | 8.4% |
| Standard Deviation (Population) | 3.6% | 8.3% |
Similar Demographics by Master's Degree
Demographics Similar to Sioux by Master's Degree
In terms of master's degree, the demographic groups most similar to Sioux are Crow (10.6%, a difference of 0.39%), Dutch West Indian (10.6%, a difference of 0.44%), Pennsylvania German (10.7%, a difference of 0.64%), Immigrants from Micronesia (10.8%, a difference of 0.85%), and Kiowa (10.8%, a difference of 1.5%).
| Demographics | Rating | Rank | Master's Degree |
| Apache | 0.0 /100 | #315 | Tragic 11.0% |
| Hispanics or Latinos | 0.0 /100 | #316 | Tragic 10.9% |
| Hopi | 0.0 /100 | #317 | Tragic 10.9% |
| Immigrants | Cuba | 0.0 /100 | #318 | Tragic 10.9% |
| Kiowa | 0.0 /100 | #319 | Tragic 10.8% |
| Immigrants | Micronesia | 0.0 /100 | #320 | Tragic 10.8% |
| Pennsylvania Germans | 0.0 /100 | #321 | Tragic 10.7% |
| Sioux | 0.0 /100 | #322 | Tragic 10.7% |
| Crow | 0.0 /100 | #323 | Tragic 10.6% |
| Dutch West Indians | 0.0 /100 | #324 | Tragic 10.6% |
| Inupiat | 0.0 /100 | #325 | Tragic 10.5% |
| Creek | 0.0 /100 | #326 | Tragic 10.5% |
| Paiute | 0.0 /100 | #327 | Tragic 10.5% |
| Bangladeshis | 0.0 /100 | #328 | Tragic 10.5% |
| Nepalese | 0.0 /100 | #329 | Tragic 10.5% |
Demographics Similar to Immigrants from Zimbabwe by Master's Degree
In terms of master's degree, the demographic groups most similar to Immigrants from Zimbabwe are Greek (17.5%, a difference of 0.050%), Immigrants from Western Asia (17.5%, a difference of 0.11%), Immigrants from Scotland (17.4%, a difference of 0.33%), Carpatho Rusyn (17.5%, a difference of 0.40%), and Immigrants from Lebanon (17.5%, a difference of 0.46%).
| Demographics | Rating | Rank | Master's Degree |
| Immigrants | Indonesia | 99.6 /100 | #76 | Exceptional 17.6% |
| Immigrants | Eastern Europe | 99.6 /100 | #77 | Exceptional 17.6% |
| Immigrants | Hungary | 99.6 /100 | #78 | Exceptional 17.5% |
| Immigrants | Lebanon | 99.6 /100 | #79 | Exceptional 17.5% |
| Carpatho Rusyns | 99.6 /100 | #80 | Exceptional 17.5% |
| Immigrants | Western Asia | 99.5 /100 | #81 | Exceptional 17.5% |
| Greeks | 99.5 /100 | #82 | Exceptional 17.5% |
| Immigrants | Zimbabwe | 99.5 /100 | #83 | Exceptional 17.4% |
| Immigrants | Scotland | 99.4 /100 | #84 | Exceptional 17.4% |
| Immigrants | Brazil | 99.4 /100 | #85 | Exceptional 17.4% |
| Immigrants | Croatia | 99.3 /100 | #86 | Exceptional 17.3% |
| Maltese | 99.3 /100 | #87 | Exceptional 17.3% |
| Immigrants | Canada | 99.2 /100 | #88 | Exceptional 17.2% |
| Bhutanese | 99.1 /100 | #89 | Exceptional 17.2% |
| Immigrants | Egypt | 99.1 /100 | #90 | Exceptional 17.2% |