Sioux vs Belgian Doctorate Degree
COMPARE
Sioux
Belgian
Doctorate Degree
Doctorate Degree Comparison
Sioux
Belgians
1.5%
DOCTORATE DEGREE
0.4/ 100
METRIC RATING
273rd/ 347
METRIC RANK
1.8%
DOCTORATE DEGREE
50.3/ 100
METRIC RATING
172nd/ 347
METRIC RANK
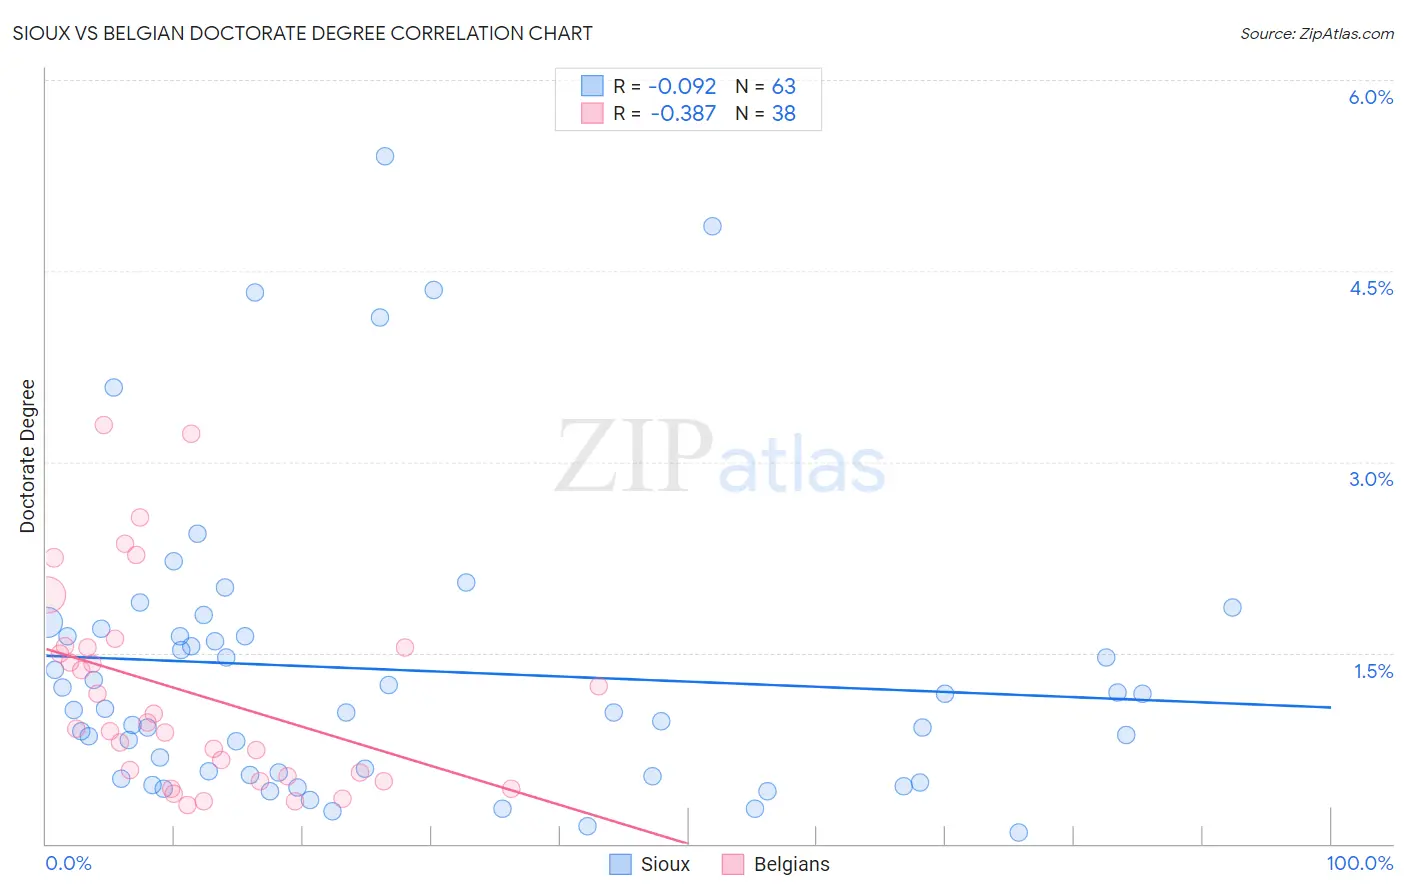
Sioux vs Belgian Doctorate Degree Correlation Chart
The statistical analysis conducted on geographies consisting of 231,042,673 people shows a slight negative correlation between the proportion of Sioux and percentage of population with at least doctorate degree education in the United States with a correlation coefficient (R) of -0.092 and weighted average of 1.5%. Similarly, the statistical analysis conducted on geographies consisting of 351,946,706 people shows a mild negative correlation between the proportion of Belgians and percentage of population with at least doctorate degree education in the United States with a correlation coefficient (R) of -0.387 and weighted average of 1.8%, a difference of 24.9%.
Doctorate Degree Correlation Summary
| Measurement | Sioux | Belgian |
| Minimum | 0.086% | 0.30% |
| Maximum | 5.4% | 3.3% |
| Range | 5.3% | 3.0% |
| Mean | 1.4% | 1.2% |
| Median | 1.1% | 0.93% |
| Interquartile 25% (IQ1) | 0.54% | 0.53% |
| Interquartile 75% (IQ3) | 1.6% | 1.5% |
| Interquartile Range (IQR) | 1.1% | 1.0% |
| Standard Deviation (Sample) | 1.2% | 0.80% |
| Standard Deviation (Population) | 1.2% | 0.79% |
Similar Demographics by Doctorate Degree
Demographics Similar to Sioux by Doctorate Degree
In terms of doctorate degree, the demographic groups most similar to Sioux are Yaqui (1.5%, a difference of 0.020%), Immigrants from Barbados (1.5%, a difference of 0.11%), Aleut (1.5%, a difference of 0.14%), Paiute (1.5%, a difference of 0.19%), and Immigrants from Trinidad and Tobago (1.5%, a difference of 0.20%).
| Demographics | Rating | Rank | Doctorate Degree |
| Immigrants | Liberia | 0.5 /100 | #266 | Tragic 1.5% |
| Kiowa | 0.5 /100 | #267 | Tragic 1.5% |
| U.S. Virgin Islanders | 0.5 /100 | #268 | Tragic 1.5% |
| Crow | 0.5 /100 | #269 | Tragic 1.5% |
| Salvadorans | 0.5 /100 | #270 | Tragic 1.5% |
| Immigrants | Trinidad and Tobago | 0.5 /100 | #271 | Tragic 1.5% |
| Immigrants | Barbados | 0.4 /100 | #272 | Tragic 1.5% |
| Sioux | 0.4 /100 | #273 | Tragic 1.5% |
| Yaqui | 0.4 /100 | #274 | Tragic 1.5% |
| Aleuts | 0.4 /100 | #275 | Tragic 1.5% |
| Paiute | 0.4 /100 | #276 | Tragic 1.5% |
| Bahamians | 0.4 /100 | #277 | Tragic 1.5% |
| Hawaiians | 0.4 /100 | #278 | Tragic 1.5% |
| Marshallese | 0.4 /100 | #279 | Tragic 1.5% |
| Ecuadorians | 0.4 /100 | #280 | Tragic 1.5% |
Demographics Similar to Belgians by Doctorate Degree
In terms of doctorate degree, the demographic groups most similar to Belgians are Norwegian (1.8%, a difference of 0.040%), Immigrants from Bangladesh (1.8%, a difference of 0.040%), Immigrants from Thailand (1.8%, a difference of 0.12%), Spanish (1.8%, a difference of 0.14%), and Iraqi (1.8%, a difference of 0.15%).
| Demographics | Rating | Rank | Doctorate Degree |
| Scotch-Irish | 63.6 /100 | #165 | Good 1.9% |
| Spaniards | 63.5 /100 | #166 | Good 1.9% |
| Macedonians | 60.9 /100 | #167 | Good 1.9% |
| Sri Lankans | 60.3 /100 | #168 | Good 1.9% |
| Vietnamese | 54.8 /100 | #169 | Average 1.9% |
| Costa Ricans | 53.3 /100 | #170 | Average 1.8% |
| Bermudans | 52.1 /100 | #171 | Average 1.8% |
| Belgians | 50.3 /100 | #172 | Average 1.8% |
| Norwegians | 50.0 /100 | #173 | Average 1.8% |
| Immigrants | Bangladesh | 50.0 /100 | #174 | Average 1.8% |
| Immigrants | Thailand | 49.4 /100 | #175 | Average 1.8% |
| Spanish | 49.3 /100 | #176 | Average 1.8% |
| Iraqis | 49.2 /100 | #177 | Average 1.8% |
| French | 48.8 /100 | #178 | Average 1.8% |
| Ghanaians | 48.3 /100 | #179 | Average 1.8% |