Immigrants from El Salvador vs Barbadian Professional Degree
COMPARE
Immigrants from El Salvador
Barbadian
Professional Degree
Professional Degree Comparison
Immigrants from El Salvador
Barbadians
3.5%
PROFESSIONAL DEGREE
0.3/ 100
METRIC RATING
287th/ 347
METRIC RANK
4.1%
PROFESSIONAL DEGREE
15.8/ 100
METRIC RATING
204th/ 347
METRIC RANK
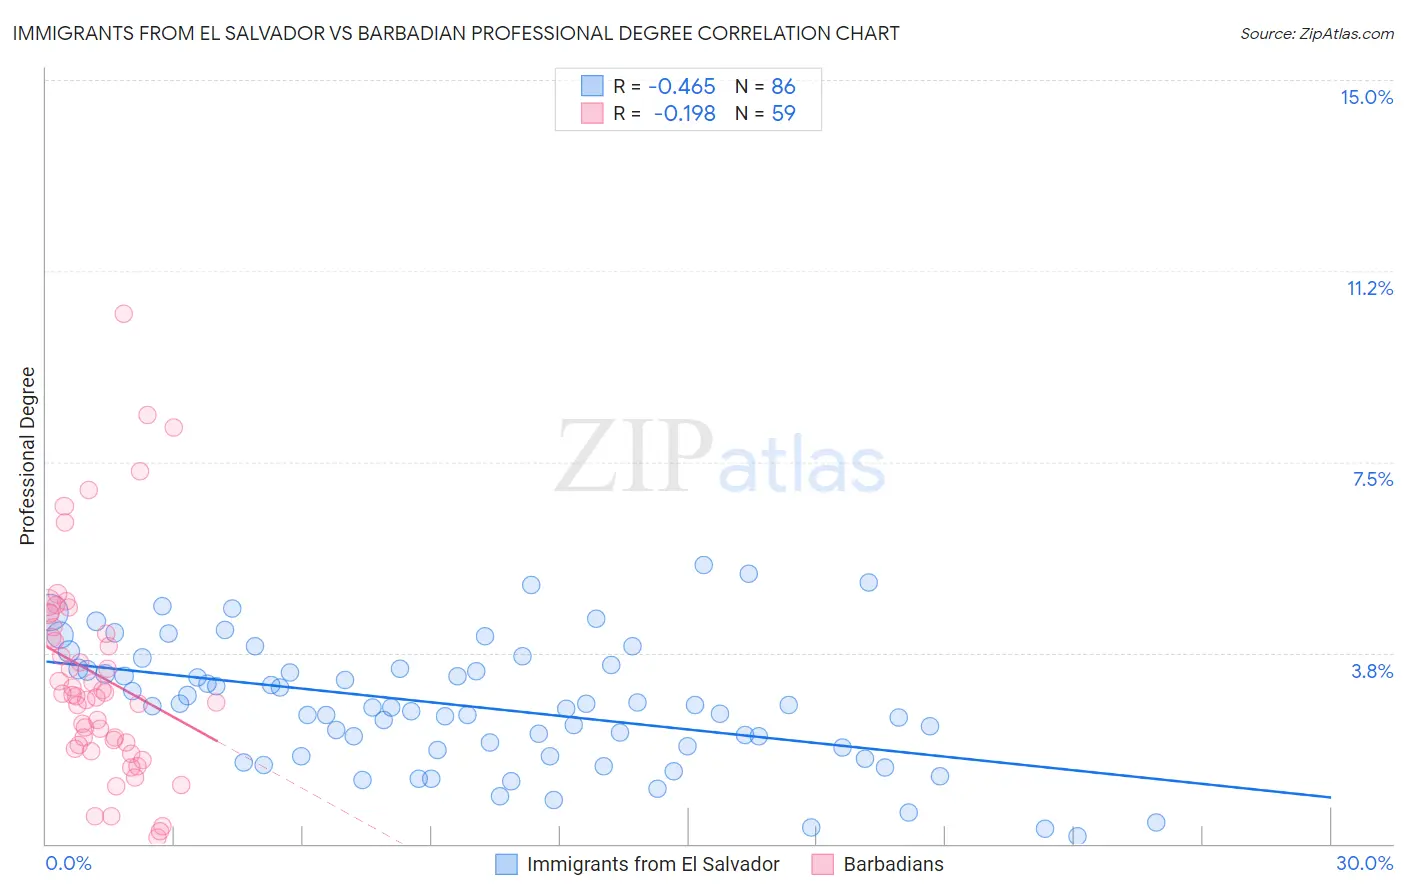
Immigrants from El Salvador vs Barbadian Professional Degree Correlation Chart
The statistical analysis conducted on geographies consisting of 356,542,562 people shows a moderate negative correlation between the proportion of Immigrants from El Salvador and percentage of population with at least professional degree education in the United States with a correlation coefficient (R) of -0.465 and weighted average of 3.5%. Similarly, the statistical analysis conducted on geographies consisting of 141,223,828 people shows a poor negative correlation between the proportion of Barbadians and percentage of population with at least professional degree education in the United States with a correlation coefficient (R) of -0.198 and weighted average of 4.1%, a difference of 19.1%.
Professional Degree Correlation Summary
| Measurement | Immigrants from El Salvador | Barbadian |
| Minimum | 0.14% | 0.13% |
| Maximum | 5.5% | 10.4% |
| Range | 5.3% | 10.3% |
| Mean | 2.7% | 3.3% |
| Median | 2.7% | 2.9% |
| Interquartile 25% (IQ1) | 1.8% | 1.9% |
| Interquartile 75% (IQ3) | 3.4% | 4.2% |
| Interquartile Range (IQR) | 1.6% | 2.3% |
| Standard Deviation (Sample) | 1.2% | 2.1% |
| Standard Deviation (Population) | 1.2% | 2.1% |
Similar Demographics by Professional Degree
Demographics Similar to Immigrants from El Salvador by Professional Degree
In terms of professional degree, the demographic groups most similar to Immigrants from El Salvador are Blackfeet (3.5%, a difference of 0.050%), Haitian (3.5%, a difference of 0.10%), Guatemalan (3.5%, a difference of 0.22%), Chippewa (3.5%, a difference of 0.23%), and Alaska Native (3.5%, a difference of 0.41%).
| Demographics | Rating | Rank | Professional Degree |
| Dominicans | 0.5 /100 | #280 | Tragic 3.5% |
| Apache | 0.5 /100 | #281 | Tragic 3.5% |
| Immigrants | Caribbean | 0.5 /100 | #282 | Tragic 3.5% |
| Comanche | 0.4 /100 | #283 | Tragic 3.5% |
| Salvadorans | 0.4 /100 | #284 | Tragic 3.5% |
| Hondurans | 0.3 /100 | #285 | Tragic 3.5% |
| Haitians | 0.3 /100 | #286 | Tragic 3.5% |
| Immigrants | El Salvador | 0.3 /100 | #287 | Tragic 3.5% |
| Blackfeet | 0.3 /100 | #288 | Tragic 3.5% |
| Guatemalans | 0.3 /100 | #289 | Tragic 3.5% |
| Chippewa | 0.3 /100 | #290 | Tragic 3.5% |
| Alaska Natives | 0.3 /100 | #291 | Tragic 3.5% |
| Immigrants | Belize | 0.3 /100 | #292 | Tragic 3.5% |
| Immigrants | Honduras | 0.3 /100 | #293 | Tragic 3.5% |
| Paiute | 0.3 /100 | #294 | Tragic 3.4% |
Demographics Similar to Barbadians by Professional Degree
In terms of professional degree, the demographic groups most similar to Barbadians are Panamanian (4.1%, a difference of 0.030%), Somali (4.1%, a difference of 0.32%), Immigrants from Iraq (4.2%, a difference of 0.36%), Yugoslavian (4.1%, a difference of 0.75%), and Finnish (4.2%, a difference of 0.79%).
| Demographics | Rating | Rank | Professional Degree |
| Czechoslovakians | 22.4 /100 | #197 | Fair 4.2% |
| Immigrants | Middle Africa | 22.1 /100 | #198 | Fair 4.2% |
| Norwegians | 20.5 /100 | #199 | Fair 4.2% |
| Immigrants | North Macedonia | 20.2 /100 | #200 | Fair 4.2% |
| Finns | 18.7 /100 | #201 | Poor 4.2% |
| Immigrants | Iraq | 17.1 /100 | #202 | Poor 4.2% |
| Panamanians | 15.9 /100 | #203 | Poor 4.1% |
| Barbadians | 15.8 /100 | #204 | Poor 4.1% |
| Somalis | 14.8 /100 | #205 | Poor 4.1% |
| Yugoslavians | 13.4 /100 | #206 | Poor 4.1% |
| Sub-Saharan Africans | 12.8 /100 | #207 | Poor 4.1% |
| Immigrants | Somalia | 12.5 /100 | #208 | Poor 4.1% |
| Immigrants | Panama | 12.3 /100 | #209 | Poor 4.1% |
| Immigrants | Nigeria | 11.7 /100 | #210 | Poor 4.1% |
| Germans | 11.6 /100 | #211 | Poor 4.1% |