Osage vs Barbadian Professional Degree
COMPARE
Osage
Barbadian
Professional Degree
Professional Degree Comparison
Osage
Barbadians
3.7%
PROFESSIONAL DEGREE
1.2/ 100
METRIC RATING
255th/ 347
METRIC RANK
4.1%
PROFESSIONAL DEGREE
15.8/ 100
METRIC RATING
204th/ 347
METRIC RANK
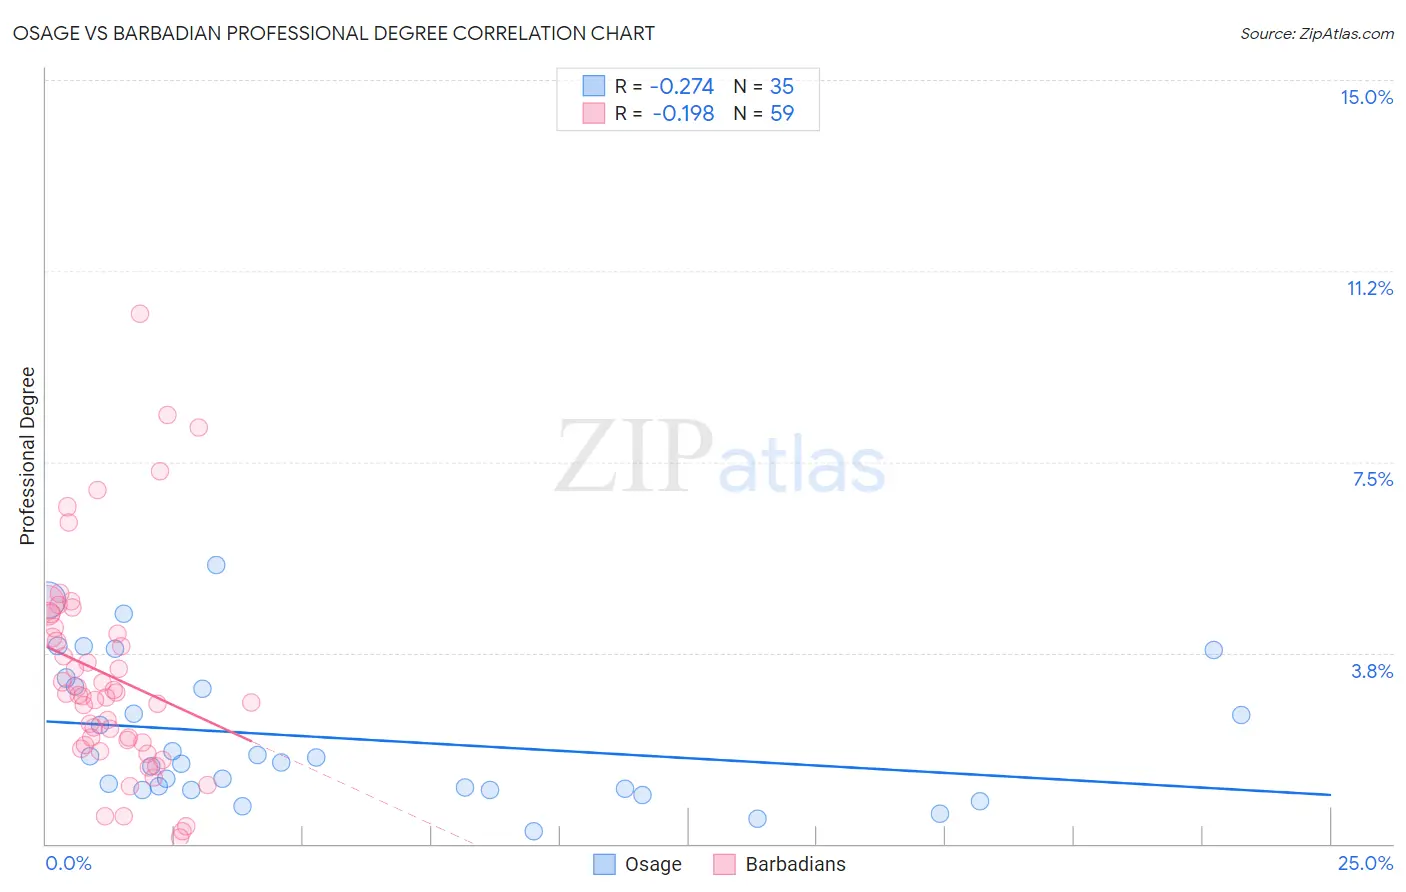
Osage vs Barbadian Professional Degree Correlation Chart
The statistical analysis conducted on geographies consisting of 91,695,993 people shows a weak negative correlation between the proportion of Osage and percentage of population with at least professional degree education in the United States with a correlation coefficient (R) of -0.274 and weighted average of 3.7%. Similarly, the statistical analysis conducted on geographies consisting of 141,223,828 people shows a poor negative correlation between the proportion of Barbadians and percentage of population with at least professional degree education in the United States with a correlation coefficient (R) of -0.198 and weighted average of 4.1%, a difference of 11.9%.
Professional Degree Correlation Summary
| Measurement | Osage | Barbadian |
| Minimum | 0.26% | 0.13% |
| Maximum | 5.5% | 10.4% |
| Range | 5.2% | 10.3% |
| Mean | 2.1% | 3.3% |
| Median | 1.6% | 2.9% |
| Interquartile 25% (IQ1) | 1.1% | 1.9% |
| Interquartile 75% (IQ3) | 3.1% | 4.2% |
| Interquartile Range (IQR) | 2.0% | 2.3% |
| Standard Deviation (Sample) | 1.4% | 2.1% |
| Standard Deviation (Population) | 1.3% | 2.1% |
Similar Demographics by Professional Degree
Demographics Similar to Osage by Professional Degree
In terms of professional degree, the demographic groups most similar to Osage are Iroquois (3.7%, a difference of 0.10%), Tongan (3.7%, a difference of 0.43%), Bahamian (3.7%, a difference of 0.47%), Immigrants from St. Vincent and the Grenadines (3.7%, a difference of 0.54%), and Pueblo (3.7%, a difference of 0.57%).
| Demographics | Rating | Rank | Professional Degree |
| Hmong | 1.6 /100 | #248 | Tragic 3.7% |
| Immigrants | Grenada | 1.5 /100 | #249 | Tragic 3.7% |
| Immigrants | Fiji | 1.5 /100 | #250 | Tragic 3.7% |
| Immigrants | Nicaragua | 1.4 /100 | #251 | Tragic 3.7% |
| Jamaicans | 1.4 /100 | #252 | Tragic 3.7% |
| Pueblo | 1.4 /100 | #253 | Tragic 3.7% |
| Tongans | 1.3 /100 | #254 | Tragic 3.7% |
| Osage | 1.2 /100 | #255 | Tragic 3.7% |
| Iroquois | 1.2 /100 | #256 | Tragic 3.7% |
| Bahamians | 1.1 /100 | #257 | Tragic 3.7% |
| Immigrants | St. Vincent and the Grenadines | 1.1 /100 | #258 | Tragic 3.7% |
| Africans | 1.0 /100 | #259 | Tragic 3.7% |
| Indonesians | 1.0 /100 | #260 | Tragic 3.7% |
| Immigrants | Guyana | 1.0 /100 | #261 | Tragic 3.7% |
| U.S. Virgin Islanders | 1.0 /100 | #262 | Tragic 3.7% |
Demographics Similar to Barbadians by Professional Degree
In terms of professional degree, the demographic groups most similar to Barbadians are Panamanian (4.1%, a difference of 0.030%), Somali (4.1%, a difference of 0.32%), Immigrants from Iraq (4.2%, a difference of 0.36%), Yugoslavian (4.1%, a difference of 0.75%), and Finnish (4.2%, a difference of 0.79%).
| Demographics | Rating | Rank | Professional Degree |
| Czechoslovakians | 22.4 /100 | #197 | Fair 4.2% |
| Immigrants | Middle Africa | 22.1 /100 | #198 | Fair 4.2% |
| Norwegians | 20.5 /100 | #199 | Fair 4.2% |
| Immigrants | North Macedonia | 20.2 /100 | #200 | Fair 4.2% |
| Finns | 18.7 /100 | #201 | Poor 4.2% |
| Immigrants | Iraq | 17.1 /100 | #202 | Poor 4.2% |
| Panamanians | 15.9 /100 | #203 | Poor 4.1% |
| Barbadians | 15.8 /100 | #204 | Poor 4.1% |
| Somalis | 14.8 /100 | #205 | Poor 4.1% |
| Yugoslavians | 13.4 /100 | #206 | Poor 4.1% |
| Sub-Saharan Africans | 12.8 /100 | #207 | Poor 4.1% |
| Immigrants | Somalia | 12.5 /100 | #208 | Poor 4.1% |
| Immigrants | Panama | 12.3 /100 | #209 | Poor 4.1% |
| Immigrants | Nigeria | 11.7 /100 | #210 | Poor 4.1% |
| Germans | 11.6 /100 | #211 | Poor 4.1% |