Sierra Leonean vs Immigrants from Nigeria 2nd Grade
COMPARE
Sierra Leonean
Immigrants from Nigeria
2nd Grade
2nd Grade Comparison
Sierra Leoneans
Immigrants from Nigeria
97.6%
2ND GRADE
4.3/ 100
METRIC RATING
223rd/ 347
METRIC RANK
97.4%
2ND GRADE
0.3/ 100
METRIC RATING
268th/ 347
METRIC RANK
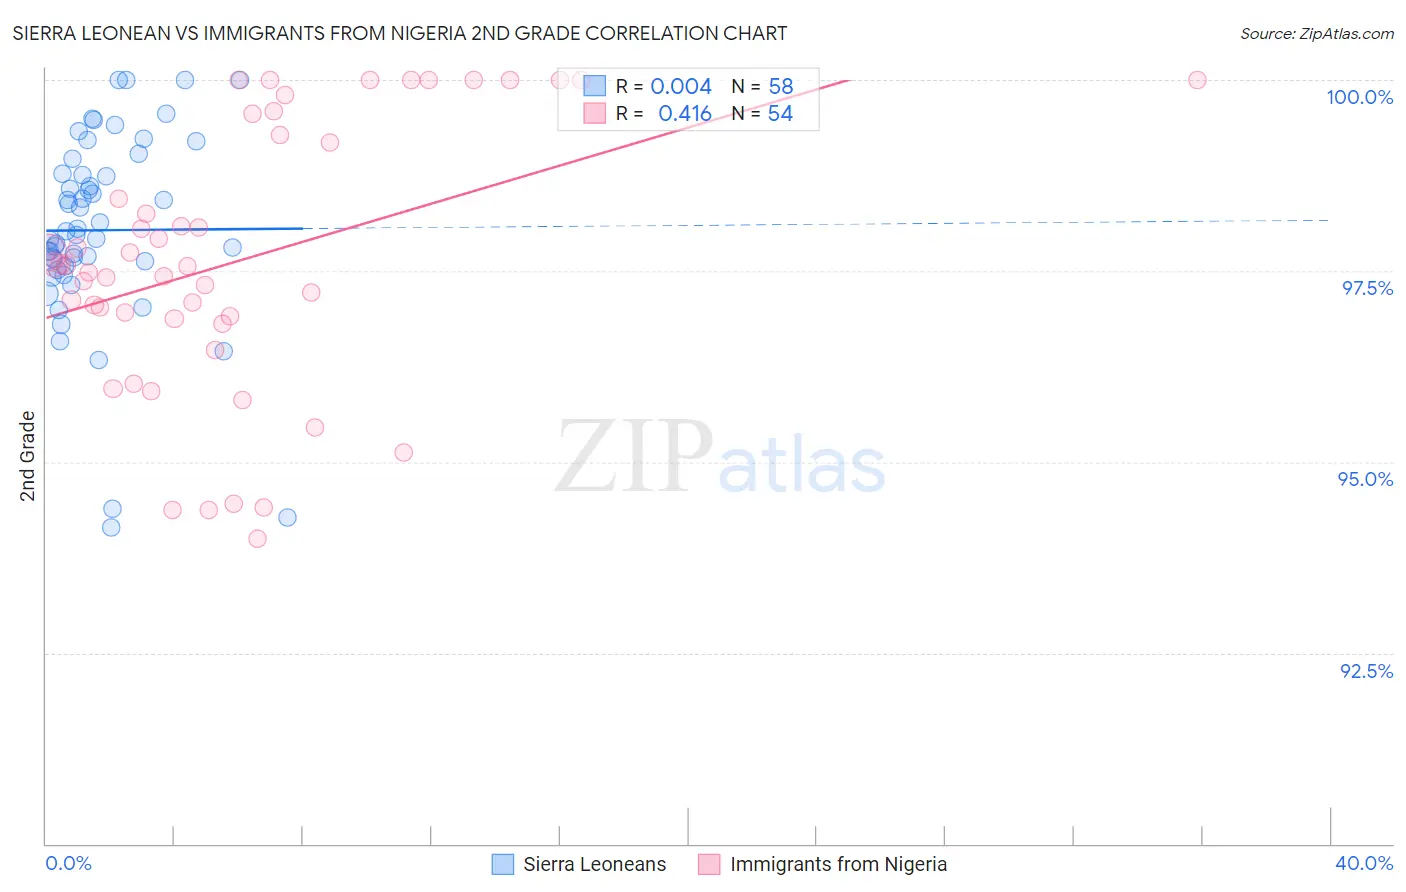
Sierra Leonean vs Immigrants from Nigeria 2nd Grade Correlation Chart
The statistical analysis conducted on geographies consisting of 83,337,655 people shows no correlation between the proportion of Sierra Leoneans and percentage of population with at least 2nd grade education in the United States with a correlation coefficient (R) of 0.004 and weighted average of 97.6%. Similarly, the statistical analysis conducted on geographies consisting of 283,430,369 people shows a moderate positive correlation between the proportion of Immigrants from Nigeria and percentage of population with at least 2nd grade education in the United States with a correlation coefficient (R) of 0.416 and weighted average of 97.4%, a difference of 0.22%.
2nd Grade Correlation Summary
| Measurement | Sierra Leonean | Immigrants from Nigeria |
| Minimum | 94.1% | 94.0% |
| Maximum | 100.0% | 100.0% |
| Range | 5.9% | 6.0% |
| Mean | 98.0% | 97.6% |
| Median | 98.0% | 97.6% |
| Interquartile 25% (IQ1) | 97.6% | 96.9% |
| Interquartile 75% (IQ3) | 98.8% | 99.3% |
| Interquartile Range (IQR) | 1.2% | 2.4% |
| Standard Deviation (Sample) | 1.3% | 1.7% |
| Standard Deviation (Population) | 1.3% | 1.7% |
Similar Demographics by 2nd Grade
Demographics Similar to Sierra Leoneans by 2nd Grade
In terms of 2nd grade, the demographic groups most similar to Sierra Leoneans are Immigrants from Sudan (97.6%, a difference of 0.0%), Immigrants from Zaire (97.6%, a difference of 0.0%), Tongan (97.6%, a difference of 0.0%), Immigrants from Morocco (97.6%, a difference of 0.010%), and Iraqi (97.6%, a difference of 0.010%).
| Demographics | Rating | Rank | 2nd Grade |
| South American Indians | 6.7 /100 | #216 | Tragic 97.7% |
| Uruguayans | 6.2 /100 | #217 | Tragic 97.7% |
| Sudanese | 5.7 /100 | #218 | Tragic 97.7% |
| Immigrants | Panama | 5.1 /100 | #219 | Tragic 97.6% |
| Immigrants | Morocco | 5.0 /100 | #220 | Tragic 97.6% |
| Iraqis | 4.6 /100 | #221 | Tragic 97.6% |
| Immigrants | Sudan | 4.5 /100 | #222 | Tragic 97.6% |
| Sierra Leoneans | 4.3 /100 | #223 | Tragic 97.6% |
| Immigrants | Zaire | 4.3 /100 | #224 | Tragic 97.6% |
| Tongans | 4.3 /100 | #225 | Tragic 97.6% |
| Immigrants | Syria | 4.0 /100 | #226 | Tragic 97.6% |
| Immigrants | Nepal | 4.0 /100 | #227 | Tragic 97.6% |
| Sub-Saharan Africans | 3.4 /100 | #228 | Tragic 97.6% |
| Immigrants | Costa Rica | 3.1 /100 | #229 | Tragic 97.6% |
| Senegalese | 3.1 /100 | #230 | Tragic 97.6% |
Demographics Similar to Immigrants from Nigeria by 2nd Grade
In terms of 2nd grade, the demographic groups most similar to Immigrants from Nigeria are Cuban (97.4%, a difference of 0.0%), West Indian (97.4%, a difference of 0.0%), Immigrants from Liberia (97.4%, a difference of 0.020%), Immigrants from South America (97.4%, a difference of 0.020%), and Immigrants from Sierra Leone (97.4%, a difference of 0.020%).
| Demographics | Rating | Rank | 2nd Grade |
| Armenians | 0.5 /100 | #261 | Tragic 97.5% |
| Taiwanese | 0.4 /100 | #262 | Tragic 97.4% |
| Immigrants | Ethiopia | 0.4 /100 | #263 | Tragic 97.4% |
| Immigrants | Liberia | 0.4 /100 | #264 | Tragic 97.4% |
| Immigrants | South America | 0.4 /100 | #265 | Tragic 97.4% |
| Immigrants | Sierra Leone | 0.4 /100 | #266 | Tragic 97.4% |
| Cubans | 0.3 /100 | #267 | Tragic 97.4% |
| Immigrants | Nigeria | 0.3 /100 | #268 | Tragic 97.4% |
| West Indians | 0.3 /100 | #269 | Tragic 97.4% |
| Immigrants | Jamaica | 0.2 /100 | #270 | Tragic 97.4% |
| Immigrants | Cameroon | 0.2 /100 | #271 | Tragic 97.4% |
| Immigrants | Peru | 0.1 /100 | #272 | Tragic 97.4% |
| Immigrants | Bolivia | 0.1 /100 | #273 | Tragic 97.4% |
| Ghanaians | 0.1 /100 | #274 | Tragic 97.4% |
| Immigrants | China | 0.1 /100 | #275 | Tragic 97.3% |