British West Indian vs German Russian 2nd Grade
COMPARE
British West Indian
German Russian
2nd Grade
2nd Grade Comparison
British West Indians
German Russians
97.2%
2ND GRADE
0.0/ 100
METRIC RATING
293rd/ 347
METRIC RANK
98.1%
2ND GRADE
97.4/ 100
METRIC RATING
107th/ 347
METRIC RANK
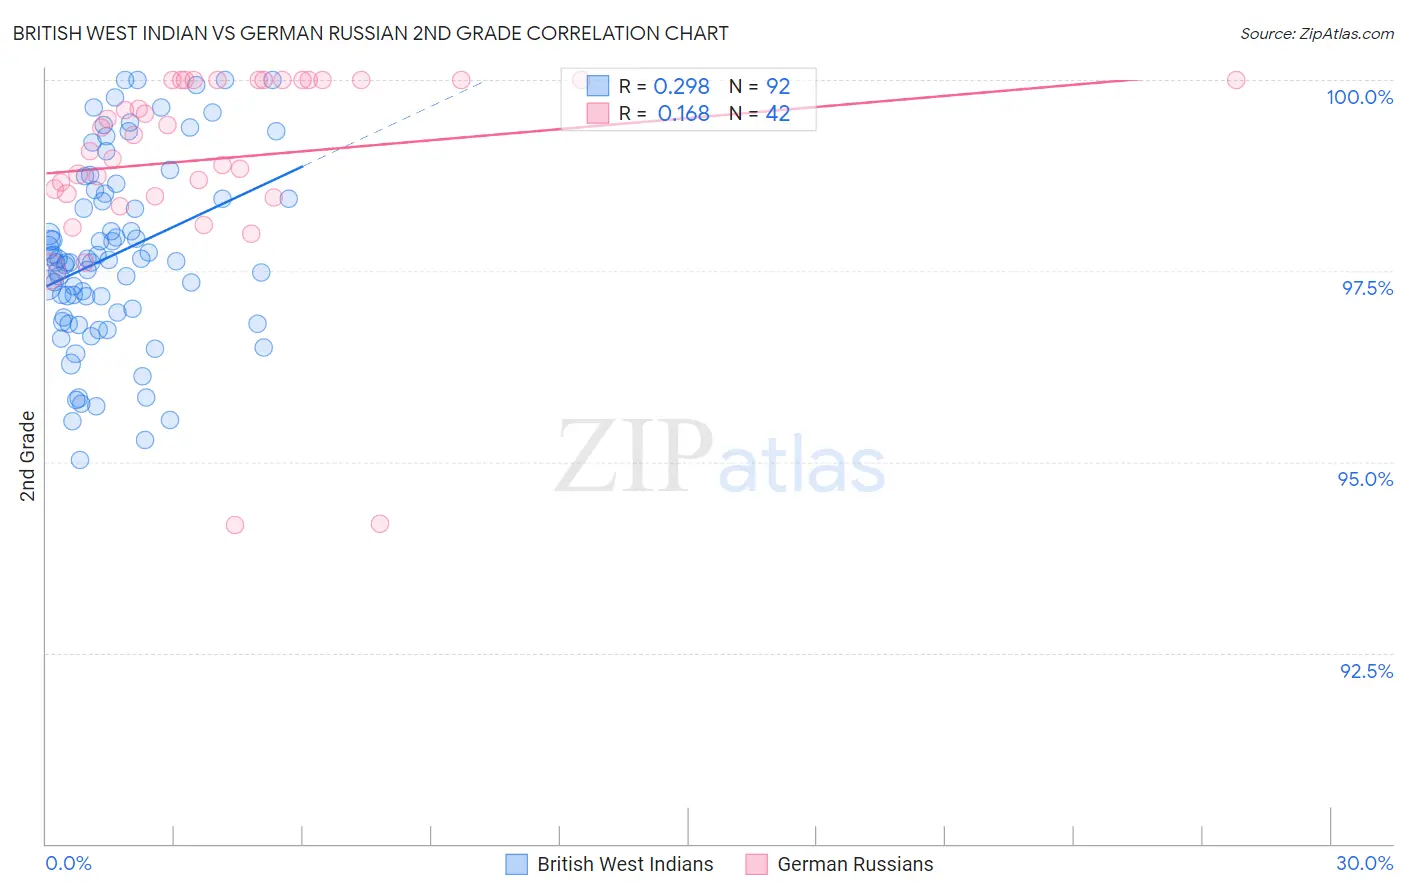
British West Indian vs German Russian 2nd Grade Correlation Chart
The statistical analysis conducted on geographies consisting of 152,691,173 people shows a weak positive correlation between the proportion of British West Indians and percentage of population with at least 2nd grade education in the United States with a correlation coefficient (R) of 0.298 and weighted average of 97.2%. Similarly, the statistical analysis conducted on geographies consisting of 96,461,520 people shows a poor positive correlation between the proportion of German Russians and percentage of population with at least 2nd grade education in the United States with a correlation coefficient (R) of 0.168 and weighted average of 98.1%, a difference of 1.0%.
2nd Grade Correlation Summary
| Measurement | British West Indian | German Russian |
| Minimum | 95.0% | 94.2% |
| Maximum | 100.0% | 100.0% |
| Range | 5.0% | 5.8% |
| Mean | 97.7% | 99.0% |
| Median | 97.6% | 99.3% |
| Interquartile 25% (IQ1) | 96.9% | 98.5% |
| Interquartile 75% (IQ3) | 98.5% | 100.0% |
| Interquartile Range (IQR) | 1.6% | 1.5% |
| Standard Deviation (Sample) | 1.2% | 1.3% |
| Standard Deviation (Population) | 1.2% | 1.3% |
Similar Demographics by 2nd Grade
Demographics Similar to British West Indians by 2nd Grade
In terms of 2nd grade, the demographic groups most similar to British West Indians are Immigrants from Eritrea (97.2%, a difference of 0.010%), Malaysian (97.1%, a difference of 0.020%), Houma (97.2%, a difference of 0.040%), Immigrants from St. Vincent and the Grenadines (97.2%, a difference of 0.040%), and Immigrants from Afghanistan (97.2%, a difference of 0.040%).
| Demographics | Rating | Rank | 2nd Grade |
| Immigrants | Barbados | 0.0 /100 | #286 | Tragic 97.2% |
| Immigrants | Portugal | 0.0 /100 | #287 | Tragic 97.2% |
| Immigrants | Thailand | 0.0 /100 | #288 | Tragic 97.2% |
| Houma | 0.0 /100 | #289 | Tragic 97.2% |
| Immigrants | St. Vincent and the Grenadines | 0.0 /100 | #290 | Tragic 97.2% |
| Immigrants | Afghanistan | 0.0 /100 | #291 | Tragic 97.2% |
| Immigrants | Eritrea | 0.0 /100 | #292 | Tragic 97.2% |
| British West Indians | 0.0 /100 | #293 | Tragic 97.2% |
| Malaysians | 0.0 /100 | #294 | Tragic 97.1% |
| Immigrants | Grenada | 0.0 /100 | #295 | Tragic 97.1% |
| Immigrants | Immigrants | 0.0 /100 | #296 | Tragic 97.1% |
| Immigrants | Cuba | 0.0 /100 | #297 | Tragic 97.0% |
| Immigrants | Dominica | 0.0 /100 | #298 | Tragic 97.0% |
| Haitians | 0.0 /100 | #299 | Tragic 97.0% |
| Immigrants | South Eastern Asia | 0.0 /100 | #300 | Tragic 97.0% |
Demographics Similar to German Russians by 2nd Grade
In terms of 2nd grade, the demographic groups most similar to German Russians are Turkish (98.2%, a difference of 0.0%), Yugoslavian (98.2%, a difference of 0.0%), Bhutanese (98.1%, a difference of 0.0%), Immigrants from Switzerland (98.1%, a difference of 0.0%), and Pima (98.2%, a difference of 0.010%).
| Demographics | Rating | Rank | 2nd Grade |
| Romanians | 98.0 /100 | #100 | Exceptional 98.2% |
| Puget Sound Salish | 98.0 /100 | #101 | Exceptional 98.2% |
| Cree | 98.0 /100 | #102 | Exceptional 98.2% |
| Pima | 97.6 /100 | #103 | Exceptional 98.2% |
| Turks | 97.6 /100 | #104 | Exceptional 98.2% |
| Yugoslavians | 97.5 /100 | #105 | Exceptional 98.2% |
| Bhutanese | 97.5 /100 | #106 | Exceptional 98.1% |
| German Russians | 97.4 /100 | #107 | Exceptional 98.1% |
| Immigrants | Switzerland | 97.3 /100 | #108 | Exceptional 98.1% |
| Basques | 97.2 /100 | #109 | Exceptional 98.1% |
| Immigrants | Singapore | 97.0 /100 | #110 | Exceptional 98.1% |
| Immigrants | Czechoslovakia | 96.9 /100 | #111 | Exceptional 98.1% |
| Colville | 96.6 /100 | #112 | Exceptional 98.1% |
| Immigrants | Norway | 96.5 /100 | #113 | Exceptional 98.1% |
| Immigrants | Latvia | 96.4 /100 | #114 | Exceptional 98.1% |