Sierra Leonean vs Thai College, 1 year or more
COMPARE
Sierra Leonean
Thai
College, 1 year or more
College, 1 year or more Comparison
Sierra Leoneans
Thais
60.2%
COLLEGE, 1 YEAR OR MORE
74.1/ 100
METRIC RATING
153rd/ 347
METRIC RANK
68.6%
COLLEGE, 1 YEAR OR MORE
100.0/ 100
METRIC RATING
8th/ 347
METRIC RANK
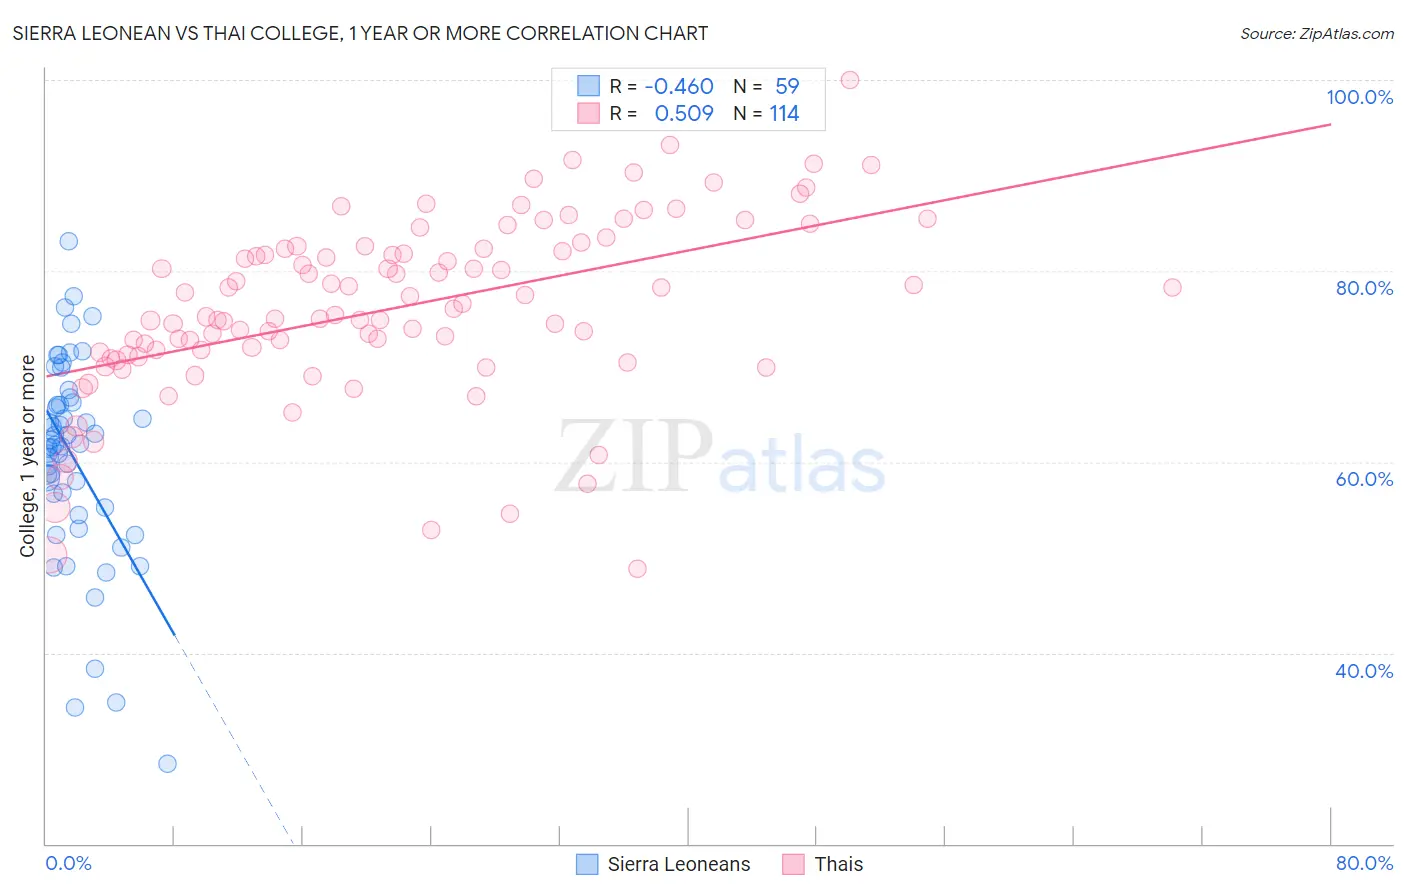
Sierra Leonean vs Thai College, 1 year or more Correlation Chart
The statistical analysis conducted on geographies consisting of 83,362,711 people shows a moderate negative correlation between the proportion of Sierra Leoneans and percentage of population with at least college, 1 year or more education in the United States with a correlation coefficient (R) of -0.460 and weighted average of 60.2%. Similarly, the statistical analysis conducted on geographies consisting of 475,810,448 people shows a substantial positive correlation between the proportion of Thais and percentage of population with at least college, 1 year or more education in the United States with a correlation coefficient (R) of 0.509 and weighted average of 68.6%, a difference of 13.9%.
College, 1 year or more Correlation Summary
| Measurement | Sierra Leonean | Thai |
| Minimum | 28.4% | 48.8% |
| Maximum | 83.1% | 100.0% |
| Range | 54.7% | 51.2% |
| Mean | 60.5% | 76.1% |
| Median | 61.8% | 75.8% |
| Interquartile 25% (IQ1) | 55.2% | 71.2% |
| Interquartile 75% (IQ3) | 66.2% | 82.3% |
| Interquartile Range (IQR) | 11.0% | 11.0% |
| Standard Deviation (Sample) | 10.6% | 9.4% |
| Standard Deviation (Population) | 10.5% | 9.3% |
Similar Demographics by College, 1 year or more
Demographics Similar to Sierra Leoneans by College, 1 year or more
In terms of college, 1 year or more, the demographic groups most similar to Sierra Leoneans are Sudanese (60.2%, a difference of 0.080%), Moroccan (60.2%, a difference of 0.080%), Finnish (60.2%, a difference of 0.080%), Immigrants from Germany (60.3%, a difference of 0.14%), and Immigrants from Sudan (60.4%, a difference of 0.27%).
| Demographics | Rating | Rank | College, 1 year or more |
| Scottish | 80.2 /100 | #146 | Excellent 60.5% |
| Immigrants | Kenya | 79.1 /100 | #147 | Good 60.5% |
| Kenyans | 79.0 /100 | #148 | Good 60.5% |
| Brazilians | 79.0 /100 | #149 | Good 60.5% |
| Immigrants | Sudan | 77.8 /100 | #150 | Good 60.4% |
| Albanians | 77.8 /100 | #151 | Good 60.4% |
| Immigrants | Germany | 76.1 /100 | #152 | Good 60.3% |
| Sierra Leoneans | 74.1 /100 | #153 | Good 60.2% |
| Sudanese | 73.0 /100 | #154 | Good 60.2% |
| Moroccans | 72.9 /100 | #155 | Good 60.2% |
| Finns | 72.9 /100 | #156 | Good 60.2% |
| Immigrants | Armenia | 68.8 /100 | #157 | Good 60.0% |
| English | 67.2 /100 | #158 | Good 60.0% |
| Immigrants | Iraq | 67.0 /100 | #159 | Good 60.0% |
| South American Indians | 66.9 /100 | #160 | Good 60.0% |
Demographics Similar to Thais by College, 1 year or more
In terms of college, 1 year or more, the demographic groups most similar to Thais are Okinawan (69.0%, a difference of 0.54%), Immigrants from Israel (67.8%, a difference of 1.2%), Immigrants from Iran (69.5%, a difference of 1.3%), Immigrants from Australia (67.7%, a difference of 1.4%), and Immigrants from Taiwan (69.6%, a difference of 1.5%).
| Demographics | Rating | Rank | College, 1 year or more |
| Filipinos | 100.0 /100 | #1 | Exceptional 71.0% |
| Immigrants | Singapore | 100.0 /100 | #2 | Exceptional 70.1% |
| Iranians | 100.0 /100 | #3 | Exceptional 70.0% |
| Immigrants | Taiwan | 100.0 /100 | #4 | Exceptional 69.6% |
| Immigrants | India | 100.0 /100 | #5 | Exceptional 69.6% |
| Immigrants | Iran | 100.0 /100 | #6 | Exceptional 69.5% |
| Okinawans | 100.0 /100 | #7 | Exceptional 69.0% |
| Thais | 100.0 /100 | #8 | Exceptional 68.6% |
| Immigrants | Israel | 100.0 /100 | #9 | Exceptional 67.8% |
| Immigrants | Australia | 100.0 /100 | #10 | Exceptional 67.7% |
| Immigrants | South Central Asia | 100.0 /100 | #11 | Exceptional 67.1% |
| Cypriots | 100.0 /100 | #12 | Exceptional 67.0% |
| Immigrants | Sweden | 100.0 /100 | #13 | Exceptional 66.8% |
| Burmese | 100.0 /100 | #14 | Exceptional 66.7% |
| Cambodians | 100.0 /100 | #15 | Exceptional 66.7% |