Cypriot vs Irish Professional Degree
COMPARE
Cypriot
Irish
Professional Degree
Professional Degree Comparison
Cypriots
Irish
6.9%
PROFESSIONAL DEGREE
100.0/ 100
METRIC RATING
11th/ 347
METRIC RANK
4.4%
PROFESSIONAL DEGREE
50.0/ 100
METRIC RATING
175th/ 347
METRIC RANK
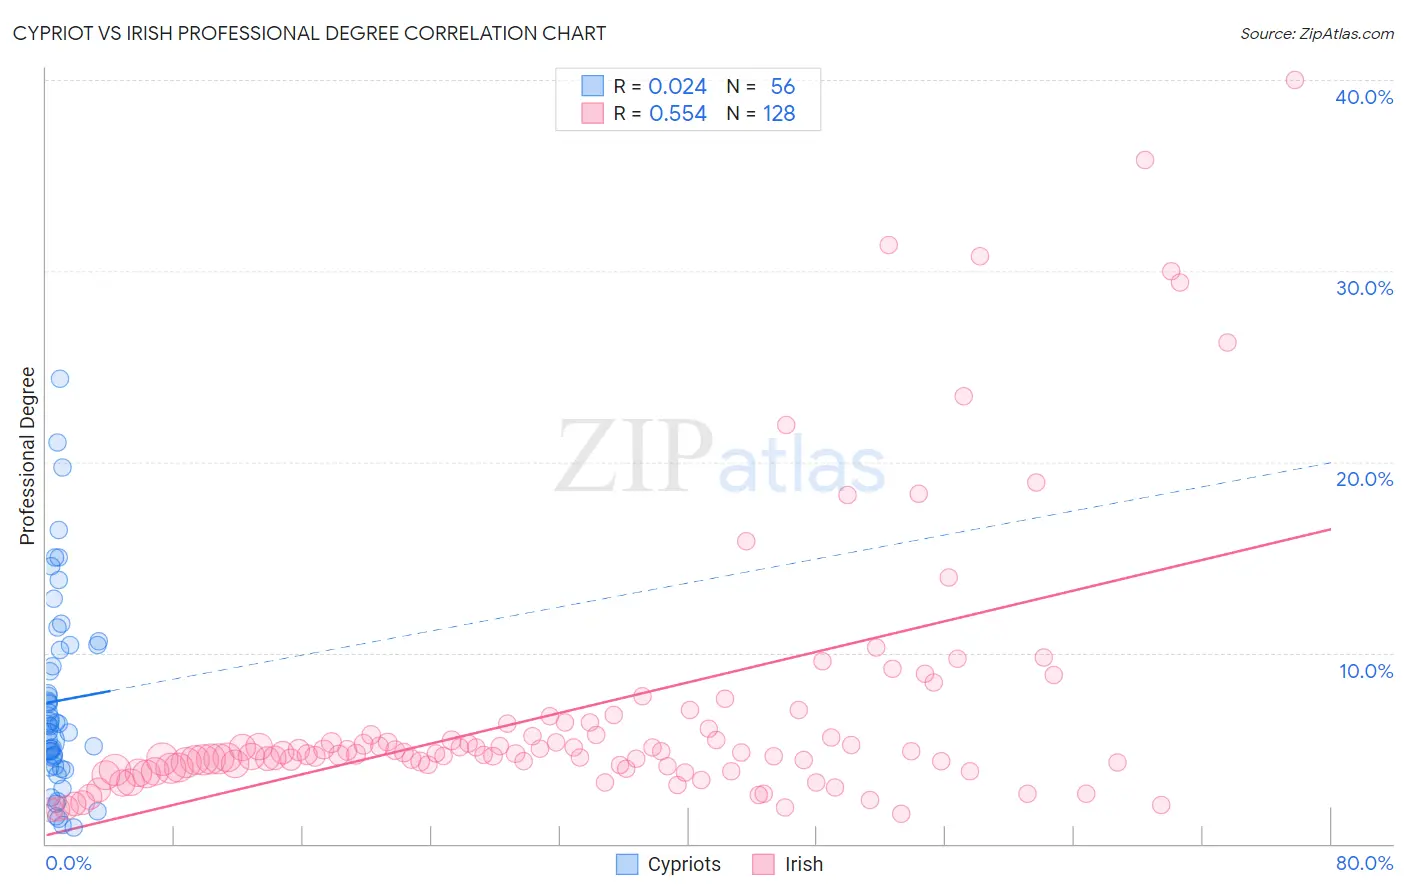
Cypriot vs Irish Professional Degree Correlation Chart
The statistical analysis conducted on geographies consisting of 61,833,042 people shows no correlation between the proportion of Cypriots and percentage of population with at least professional degree education in the United States with a correlation coefficient (R) of 0.024 and weighted average of 6.9%. Similarly, the statistical analysis conducted on geographies consisting of 569,237,980 people shows a substantial positive correlation between the proportion of Irish and percentage of population with at least professional degree education in the United States with a correlation coefficient (R) of 0.554 and weighted average of 4.4%, a difference of 57.5%.
Professional Degree Correlation Summary
| Measurement | Cypriot | Irish |
| Minimum | 0.85% | 1.5% |
| Maximum | 24.4% | 40.0% |
| Range | 23.5% | 38.5% |
| Mean | 7.5% | 7.0% |
| Median | 6.2% | 4.7% |
| Interquartile 25% (IQ1) | 4.3% | 4.0% |
| Interquartile 75% (IQ3) | 10.2% | 5.9% |
| Interquartile Range (IQR) | 6.0% | 1.9% |
| Standard Deviation (Sample) | 5.1% | 7.1% |
| Standard Deviation (Population) | 5.1% | 7.1% |
Similar Demographics by Professional Degree
Demographics Similar to Cypriots by Professional Degree
In terms of professional degree, the demographic groups most similar to Cypriots are Israeli (6.9%, a difference of 0.070%), Immigrants from Belgium (7.0%, a difference of 0.17%), Immigrants from Australia (6.9%, a difference of 0.49%), Immigrants from Taiwan (7.1%, a difference of 1.9%), and Immigrants from France (6.8%, a difference of 2.0%).
| Demographics | Rating | Rank | Professional Degree |
| Filipinos | 100.0 /100 | #4 | Exceptional 7.6% |
| Immigrants | Iran | 100.0 /100 | #5 | Exceptional 7.3% |
| Okinawans | 100.0 /100 | #6 | Exceptional 7.3% |
| Eastern Europeans | 100.0 /100 | #7 | Exceptional 7.1% |
| Immigrants | Switzerland | 100.0 /100 | #8 | Exceptional 7.1% |
| Immigrants | Taiwan | 100.0 /100 | #9 | Exceptional 7.1% |
| Immigrants | Belgium | 100.0 /100 | #10 | Exceptional 7.0% |
| Cypriots | 100.0 /100 | #11 | Exceptional 6.9% |
| Israelis | 100.0 /100 | #12 | Exceptional 6.9% |
| Immigrants | Australia | 100.0 /100 | #13 | Exceptional 6.9% |
| Immigrants | France | 100.0 /100 | #14 | Exceptional 6.8% |
| Immigrants | China | 100.0 /100 | #15 | Exceptional 6.7% |
| Immigrants | Sweden | 100.0 /100 | #16 | Exceptional 6.7% |
| Immigrants | Eastern Asia | 100.0 /100 | #17 | Exceptional 6.6% |
| Soviet Union | 100.0 /100 | #18 | Exceptional 6.6% |
Demographics Similar to Irish by Professional Degree
In terms of professional degree, the demographic groups most similar to Irish are Kenyan (4.4%, a difference of 0.0%), English (4.4%, a difference of 0.020%), Immigrants from Peru (4.4%, a difference of 0.10%), Spaniard (4.4%, a difference of 0.30%), and Celtic (4.4%, a difference of 0.35%).
| Demographics | Rating | Rank | Professional Degree |
| Immigrants | Sierra Leone | 58.7 /100 | #168 | Average 4.5% |
| Chinese | 58.6 /100 | #169 | Average 4.5% |
| Immigrants | Zaire | 57.4 /100 | #170 | Average 4.5% |
| Immigrants | Bangladesh | 56.0 /100 | #171 | Average 4.4% |
| Spaniards | 52.0 /100 | #172 | Average 4.4% |
| English | 50.1 /100 | #173 | Average 4.4% |
| Kenyans | 50.0 /100 | #174 | Average 4.4% |
| Irish | 50.0 /100 | #175 | Average 4.4% |
| Immigrants | Peru | 49.3 /100 | #176 | Average 4.4% |
| Celtics | 47.6 /100 | #177 | Average 4.4% |
| Immigrants | Costa Rica | 46.7 /100 | #178 | Average 4.4% |
| Immigrants | Kenya | 45.9 /100 | #179 | Average 4.4% |
| Czechs | 44.9 /100 | #180 | Average 4.4% |
| Danes | 43.5 /100 | #181 | Average 4.4% |
| Immigrants | Immigrants | 43.2 /100 | #182 | Average 4.4% |