Shoshone vs Immigrants from Czechoslovakia 9th Grade
COMPARE
Shoshone
Immigrants from Czechoslovakia
9th Grade
9th Grade Comparison
Shoshone
Immigrants from Czechoslovakia
95.4%
9TH GRADE
95.3/ 100
METRIC RATING
124th/ 347
METRIC RANK
95.7%
9TH GRADE
98.9/ 100
METRIC RATING
88th/ 347
METRIC RANK
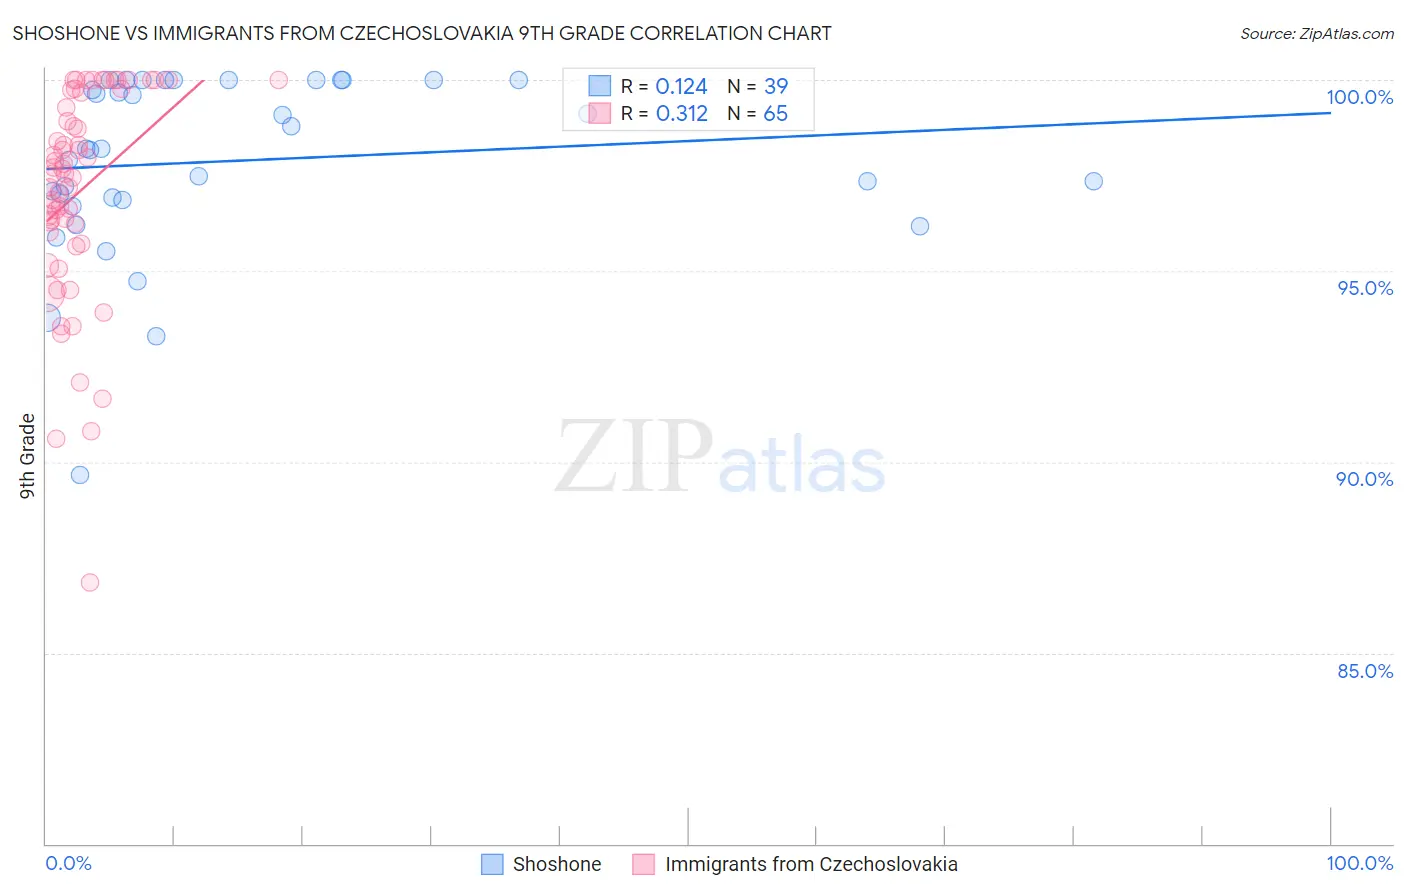
Shoshone vs Immigrants from Czechoslovakia 9th Grade Correlation Chart
The statistical analysis conducted on geographies consisting of 66,625,086 people shows a poor positive correlation between the proportion of Shoshone and percentage of population with at least 9th grade education in the United States with a correlation coefficient (R) of 0.124 and weighted average of 95.4%. Similarly, the statistical analysis conducted on geographies consisting of 195,448,106 people shows a mild positive correlation between the proportion of Immigrants from Czechoslovakia and percentage of population with at least 9th grade education in the United States with a correlation coefficient (R) of 0.312 and weighted average of 95.7%, a difference of 0.27%.
9th Grade Correlation Summary
| Measurement | Shoshone | Immigrants from Czechoslovakia |
| Minimum | 89.7% | 86.9% |
| Maximum | 100.0% | 100.0% |
| Range | 10.3% | 13.1% |
| Mean | 97.9% | 97.1% |
| Median | 98.2% | 97.5% |
| Interquartile 25% (IQ1) | 96.9% | 95.9% |
| Interquartile 75% (IQ3) | 100.0% | 99.7% |
| Interquartile Range (IQR) | 3.1% | 3.8% |
| Standard Deviation (Sample) | 2.3% | 2.8% |
| Standard Deviation (Population) | 2.3% | 2.7% |
Similar Demographics by 9th Grade
Demographics Similar to Shoshone by 9th Grade
In terms of 9th grade, the demographic groups most similar to Shoshone are Kiowa (95.4%, a difference of 0.0%), Cambodian (95.4%, a difference of 0.010%), Cree (95.4%, a difference of 0.010%), Immigrants from Kuwait (95.4%, a difference of 0.010%), and Immigrants from South Central Asia (95.4%, a difference of 0.010%).
| Demographics | Rating | Rank | 9th Grade |
| Immigrants | Romania | 95.6 /100 | #117 | Exceptional 95.4% |
| Immigrants | Turkey | 95.6 /100 | #118 | Exceptional 95.4% |
| Soviet Union | 95.6 /100 | #119 | Exceptional 95.4% |
| Cambodians | 95.6 /100 | #120 | Exceptional 95.4% |
| Cree | 95.5 /100 | #121 | Exceptional 95.4% |
| Immigrants | Kuwait | 95.5 /100 | #122 | Exceptional 95.4% |
| Kiowa | 95.3 /100 | #123 | Exceptional 95.4% |
| Shoshone | 95.3 /100 | #124 | Exceptional 95.4% |
| Immigrants | South Central Asia | 95.1 /100 | #125 | Exceptional 95.4% |
| Immigrants | Serbia | 94.4 /100 | #126 | Exceptional 95.4% |
| Palestinians | 94.3 /100 | #127 | Exceptional 95.4% |
| Immigrants | Hungary | 94.2 /100 | #128 | Exceptional 95.4% |
| Basques | 94.1 /100 | #129 | Exceptional 95.4% |
| Jordanians | 93.5 /100 | #130 | Exceptional 95.3% |
| Immigrants | North Macedonia | 92.3 /100 | #131 | Exceptional 95.3% |
Demographics Similar to Immigrants from Czechoslovakia by 9th Grade
In terms of 9th grade, the demographic groups most similar to Immigrants from Czechoslovakia are Yugoslavian (95.7%, a difference of 0.0%), Okinawan (95.7%, a difference of 0.010%), South African (95.6%, a difference of 0.010%), Creek (95.6%, a difference of 0.020%), and Immigrants from Saudi Arabia (95.6%, a difference of 0.020%).
| Demographics | Rating | Rank | 9th Grade |
| Arapaho | 99.3 /100 | #81 | Exceptional 95.7% |
| Puget Sound Salish | 99.2 /100 | #82 | Exceptional 95.7% |
| Swiss | 99.2 /100 | #83 | Exceptional 95.7% |
| Immigrants | Denmark | 99.1 /100 | #84 | Exceptional 95.7% |
| Icelanders | 99.1 /100 | #85 | Exceptional 95.7% |
| Immigrants | Western Europe | 99.1 /100 | #86 | Exceptional 95.7% |
| Okinawans | 99.0 /100 | #87 | Exceptional 95.7% |
| Immigrants | Czechoslovakia | 98.9 /100 | #88 | Exceptional 95.7% |
| Yugoslavians | 98.9 /100 | #89 | Exceptional 95.7% |
| South Africans | 98.8 /100 | #90 | Exceptional 95.6% |
| Creek | 98.8 /100 | #91 | Exceptional 95.6% |
| Immigrants | Saudi Arabia | 98.8 /100 | #92 | Exceptional 95.6% |
| Immigrants | Germany | 98.7 /100 | #93 | Exceptional 95.6% |
| Immigrants | Latvia | 98.7 /100 | #94 | Exceptional 95.6% |
| Americans | 98.5 /100 | #95 | Exceptional 95.6% |