Shoshone vs Immigrants from Sri Lanka 4th Grade
COMPARE
Shoshone
Immigrants from Sri Lanka
4th Grade
4th Grade Comparison
Shoshone
Immigrants from Sri Lanka
97.9%
4TH GRADE
98.7/ 100
METRIC RATING
94th/ 347
METRIC RANK
97.5%
4TH GRADE
51.1/ 100
METRIC RATING
172nd/ 347
METRIC RANK
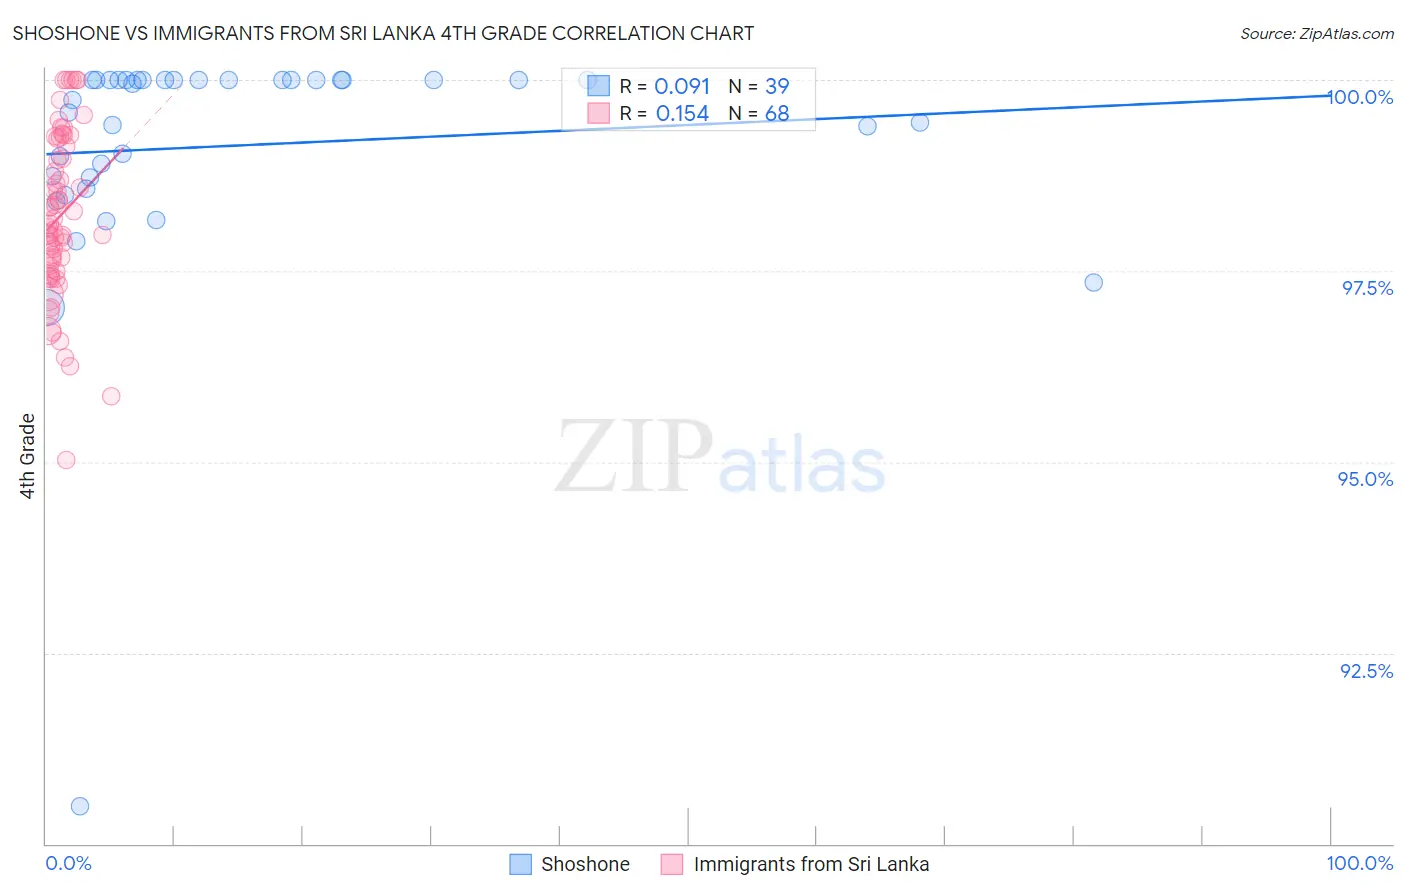
Shoshone vs Immigrants from Sri Lanka 4th Grade Correlation Chart
The statistical analysis conducted on geographies consisting of 66,625,086 people shows a slight positive correlation between the proportion of Shoshone and percentage of population with at least 4th grade education in the United States with a correlation coefficient (R) of 0.091 and weighted average of 97.9%. Similarly, the statistical analysis conducted on geographies consisting of 149,660,761 people shows a poor positive correlation between the proportion of Immigrants from Sri Lanka and percentage of population with at least 4th grade education in the United States with a correlation coefficient (R) of 0.154 and weighted average of 97.5%, a difference of 0.41%.
4th Grade Correlation Summary
| Measurement | Shoshone | Immigrants from Sri Lanka |
| Minimum | 90.5% | 95.0% |
| Maximum | 100.0% | 100.0% |
| Range | 9.5% | 5.0% |
| Mean | 99.1% | 98.2% |
| Median | 99.9% | 98.1% |
| Interquartile 25% (IQ1) | 98.7% | 97.5% |
| Interquartile 75% (IQ3) | 100.0% | 99.2% |
| Interquartile Range (IQR) | 1.3% | 1.7% |
| Standard Deviation (Sample) | 1.6% | 1.1% |
| Standard Deviation (Population) | 1.6% | 1.1% |
Similar Demographics by 4th Grade
Demographics Similar to Shoshone by 4th Grade
In terms of 4th grade, the demographic groups most similar to Shoshone are Immigrants from South Africa (97.9%, a difference of 0.0%), Delaware (97.9%, a difference of 0.0%), Immigrants from Denmark (97.9%, a difference of 0.0%), Immigrants from Sweden (97.9%, a difference of 0.0%), and Immigrants from Western Europe (97.9%, a difference of 0.0%).
| Demographics | Rating | Rank | 4th Grade |
| Zimbabweans | 98.8 /100 | #87 | Exceptional 97.9% |
| Immigrants | South Africa | 98.8 /100 | #88 | Exceptional 97.9% |
| Delaware | 98.8 /100 | #89 | Exceptional 97.9% |
| Immigrants | Denmark | 98.7 /100 | #90 | Exceptional 97.9% |
| Immigrants | Sweden | 98.7 /100 | #91 | Exceptional 97.9% |
| Immigrants | Western Europe | 98.7 /100 | #92 | Exceptional 97.9% |
| Immigrants | Ireland | 98.7 /100 | #93 | Exceptional 97.9% |
| Shoshone | 98.7 /100 | #94 | Exceptional 97.9% |
| Immigrants | Germany | 98.5 /100 | #95 | Exceptional 97.9% |
| Romanians | 98.4 /100 | #96 | Exceptional 97.9% |
| Cheyenne | 98.4 /100 | #97 | Exceptional 97.9% |
| South Africans | 98.2 /100 | #98 | Exceptional 97.9% |
| Turks | 98.2 /100 | #99 | Exceptional 97.9% |
| Yugoslavians | 98.1 /100 | #100 | Exceptional 97.9% |
| Cree | 98.1 /100 | #101 | Exceptional 97.9% |
Demographics Similar to Immigrants from Sri Lanka by 4th Grade
In terms of 4th grade, the demographic groups most similar to Immigrants from Sri Lanka are Immigrants from Spain (97.5%, a difference of 0.0%), Brazilian (97.5%, a difference of 0.0%), Immigrants from Korea (97.5%, a difference of 0.0%), Egyptian (97.5%, a difference of 0.0%), and Chilean (97.5%, a difference of 0.010%).
| Demographics | Rating | Rank | 4th Grade |
| Venezuelans | 58.7 /100 | #165 | Average 97.6% |
| Kenyans | 56.5 /100 | #166 | Average 97.5% |
| Immigrants | Poland | 55.9 /100 | #167 | Average 97.5% |
| Immigrants | Belarus | 55.8 /100 | #168 | Average 97.5% |
| Chileans | 54.4 /100 | #169 | Average 97.5% |
| Immigrants | Spain | 51.8 /100 | #170 | Average 97.5% |
| Brazilians | 51.5 /100 | #171 | Average 97.5% |
| Immigrants | Sri Lanka | 51.1 /100 | #172 | Average 97.5% |
| Immigrants | Korea | 50.6 /100 | #173 | Average 97.5% |
| Egyptians | 50.0 /100 | #174 | Average 97.5% |
| Immigrants | Micronesia | 49.6 /100 | #175 | Average 97.5% |
| Arabs | 48.7 /100 | #176 | Average 97.5% |
| Immigrants | Brazil | 46.1 /100 | #177 | Average 97.5% |
| Comanche | 45.3 /100 | #178 | Average 97.5% |
| Immigrants | Kazakhstan | 43.6 /100 | #179 | Average 97.5% |