Cambodian vs Immigrants from Iraq College, 1 year or more
COMPARE
Cambodian
Immigrants from Iraq
College, 1 year or more
College, 1 year or more Comparison
Cambodians
Immigrants from Iraq
66.7%
COLLEGE, 1 YEAR OR MORE
100.0/ 100
METRIC RATING
15th/ 347
METRIC RANK
60.0%
COLLEGE, 1 YEAR OR MORE
67.0/ 100
METRIC RATING
159th/ 347
METRIC RANK
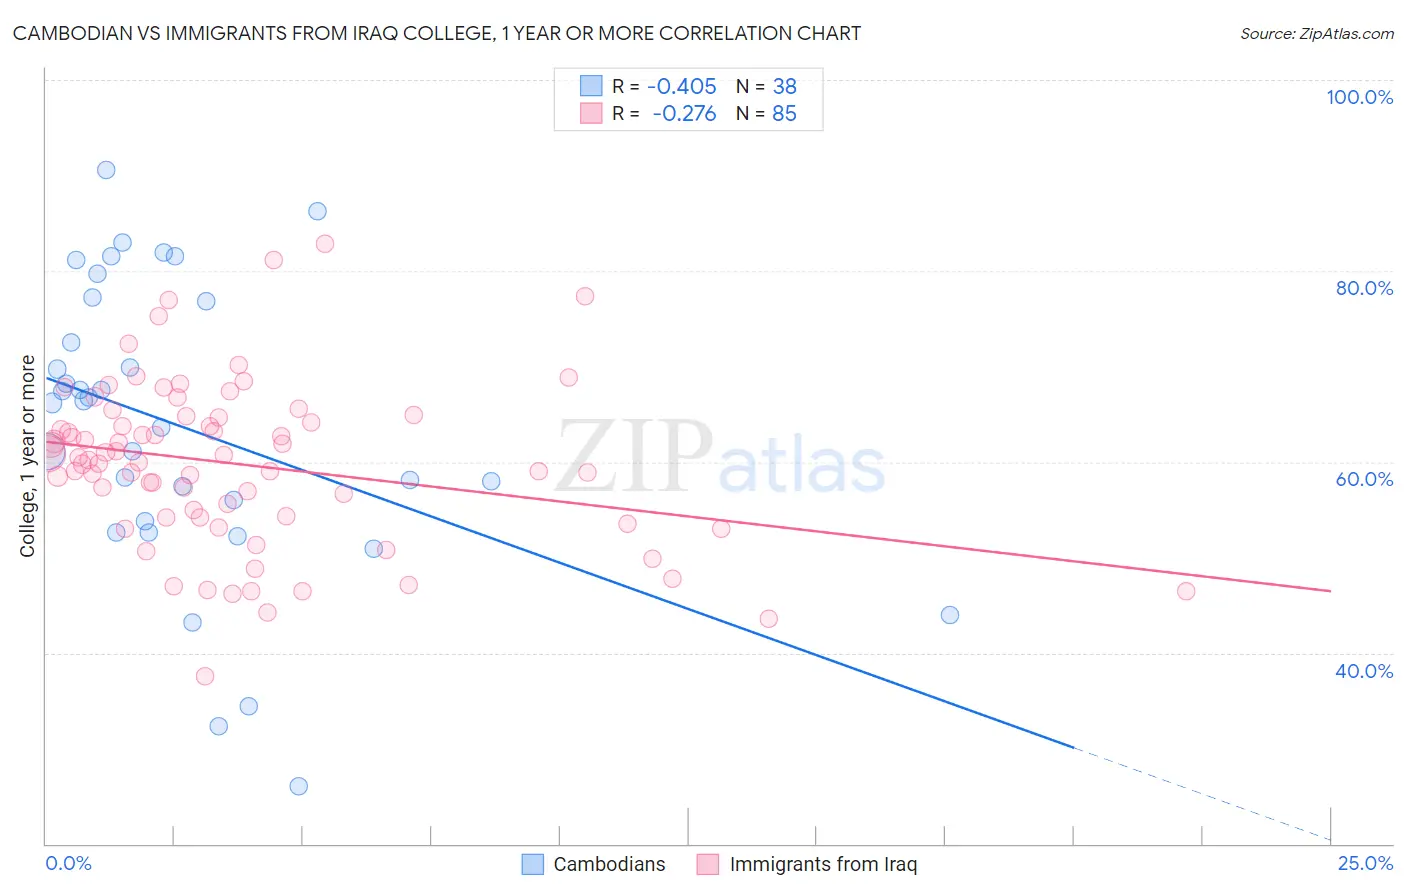
Cambodian vs Immigrants from Iraq College, 1 year or more Correlation Chart
The statistical analysis conducted on geographies consisting of 102,514,976 people shows a moderate negative correlation between the proportion of Cambodians and percentage of population with at least college, 1 year or more education in the United States with a correlation coefficient (R) of -0.405 and weighted average of 66.7%. Similarly, the statistical analysis conducted on geographies consisting of 194,780,026 people shows a weak negative correlation between the proportion of Immigrants from Iraq and percentage of population with at least college, 1 year or more education in the United States with a correlation coefficient (R) of -0.276 and weighted average of 60.0%, a difference of 11.2%.
College, 1 year or more Correlation Summary
| Measurement | Cambodian | Immigrants from Iraq |
| Minimum | 26.0% | 37.6% |
| Maximum | 90.6% | 82.9% |
| Range | 64.6% | 45.3% |
| Mean | 63.6% | 59.7% |
| Median | 66.3% | 60.2% |
| Interquartile 25% (IQ1) | 53.8% | 54.1% |
| Interquartile 75% (IQ3) | 76.8% | 64.8% |
| Interquartile Range (IQR) | 23.0% | 10.6% |
| Standard Deviation (Sample) | 15.3% | 8.6% |
| Standard Deviation (Population) | 15.1% | 8.6% |
Similar Demographics by College, 1 year or more
Demographics Similar to Cambodians by College, 1 year or more
In terms of college, 1 year or more, the demographic groups most similar to Cambodians are Burmese (66.7%, a difference of 0.0%), Immigrants from Japan (66.7%, a difference of 0.030%), Immigrants from Eastern Asia (66.6%, a difference of 0.15%), Immigrants from Sweden (66.8%, a difference of 0.19%), and Eastern European (66.6%, a difference of 0.22%).
| Demographics | Rating | Rank | College, 1 year or more |
| Thais | 100.0 /100 | #8 | Exceptional 68.6% |
| Immigrants | Israel | 100.0 /100 | #9 | Exceptional 67.8% |
| Immigrants | Australia | 100.0 /100 | #10 | Exceptional 67.7% |
| Immigrants | South Central Asia | 100.0 /100 | #11 | Exceptional 67.1% |
| Cypriots | 100.0 /100 | #12 | Exceptional 67.0% |
| Immigrants | Sweden | 100.0 /100 | #13 | Exceptional 66.8% |
| Burmese | 100.0 /100 | #14 | Exceptional 66.7% |
| Cambodians | 100.0 /100 | #15 | Exceptional 66.7% |
| Immigrants | Japan | 100.0 /100 | #16 | Exceptional 66.7% |
| Immigrants | Eastern Asia | 100.0 /100 | #17 | Exceptional 66.6% |
| Eastern Europeans | 100.0 /100 | #18 | Exceptional 66.6% |
| Immigrants | Switzerland | 100.0 /100 | #19 | Exceptional 66.5% |
| Immigrants | Korea | 100.0 /100 | #20 | Exceptional 66.5% |
| Immigrants | Hong Kong | 100.0 /100 | #21 | Exceptional 66.4% |
| Soviet Union | 100.0 /100 | #22 | Exceptional 66.4% |
Demographics Similar to Immigrants from Iraq by College, 1 year or more
In terms of college, 1 year or more, the demographic groups most similar to Immigrants from Iraq are English (60.0%, a difference of 0.010%), South American Indian (60.0%, a difference of 0.010%), Immigrants from Armenia (60.0%, a difference of 0.11%), Somali (59.9%, a difference of 0.15%), and Sudanese (60.2%, a difference of 0.37%).
| Demographics | Rating | Rank | College, 1 year or more |
| Immigrants | Germany | 76.1 /100 | #152 | Good 60.3% |
| Sierra Leoneans | 74.1 /100 | #153 | Good 60.2% |
| Sudanese | 73.0 /100 | #154 | Good 60.2% |
| Moroccans | 72.9 /100 | #155 | Good 60.2% |
| Finns | 72.9 /100 | #156 | Good 60.2% |
| Immigrants | Armenia | 68.8 /100 | #157 | Good 60.0% |
| English | 67.2 /100 | #158 | Good 60.0% |
| Immigrants | Iraq | 67.0 /100 | #159 | Good 60.0% |
| South American Indians | 66.9 /100 | #160 | Good 60.0% |
| Somalis | 64.5 /100 | #161 | Good 59.9% |
| Koreans | 58.5 /100 | #162 | Average 59.7% |
| Immigrants | Somalia | 58.3 /100 | #163 | Average 59.7% |
| Belgians | 58.1 /100 | #164 | Average 59.7% |
| Irish | 56.1 /100 | #165 | Average 59.6% |
| Immigrants | Africa | 56.1 /100 | #166 | Average 59.6% |