Hopi vs Immigrants from Honduras 7th Grade
COMPARE
Hopi
Immigrants from Honduras
7th Grade
7th Grade Comparison
Hopi
Immigrants from Honduras
96.3%
7TH GRADE
81.6/ 100
METRIC RATING
151st/ 347
METRIC RANK
92.5%
7TH GRADE
0.0/ 100
METRIC RATING
336th/ 347
METRIC RANK
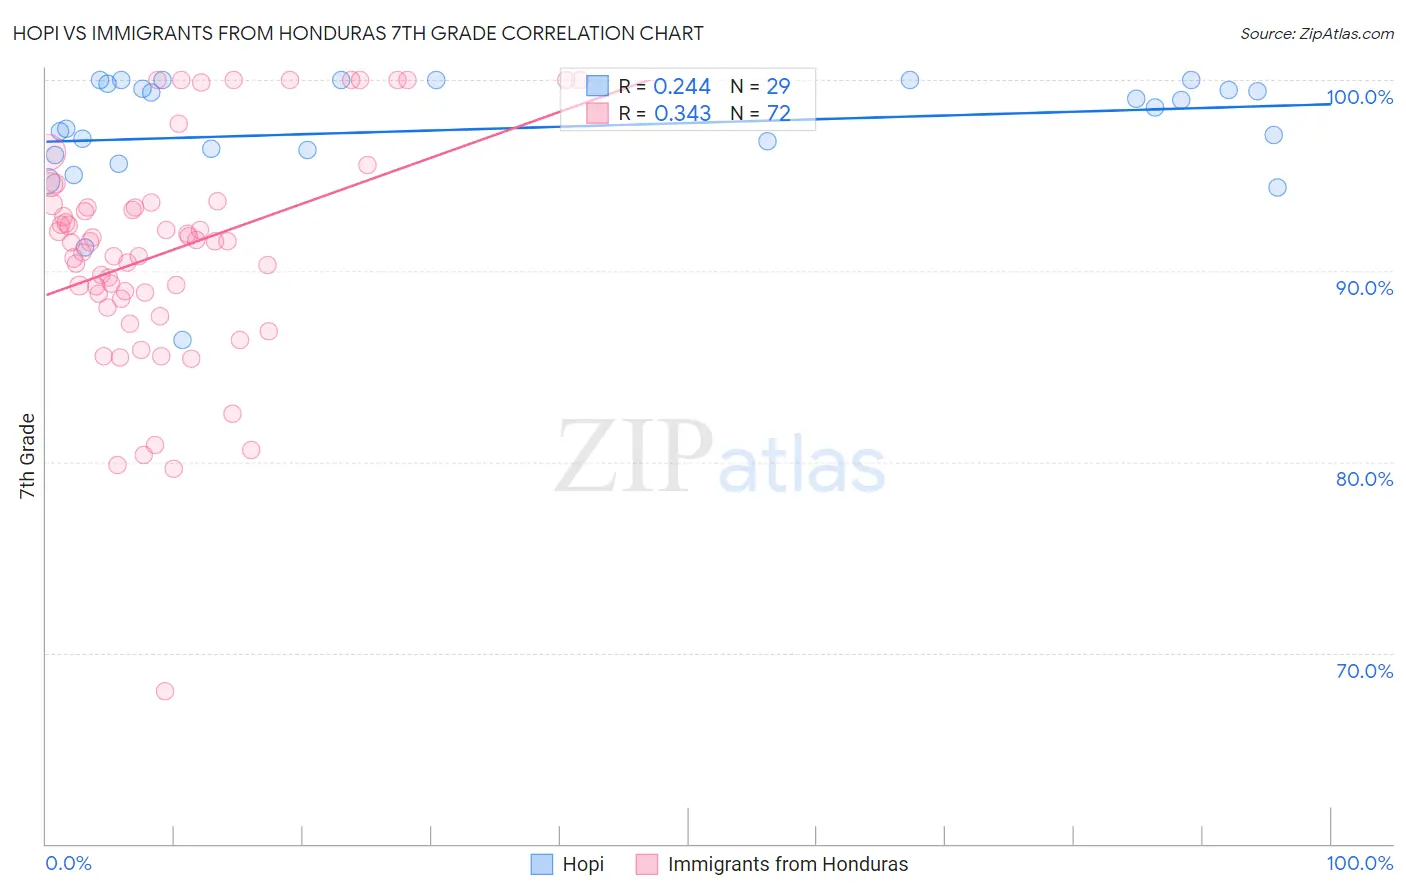
Hopi vs Immigrants from Honduras 7th Grade Correlation Chart
The statistical analysis conducted on geographies consisting of 74,739,957 people shows a weak positive correlation between the proportion of Hopi and percentage of population with at least 7th grade education in the United States with a correlation coefficient (R) of 0.244 and weighted average of 96.3%. Similarly, the statistical analysis conducted on geographies consisting of 322,637,445 people shows a mild positive correlation between the proportion of Immigrants from Honduras and percentage of population with at least 7th grade education in the United States with a correlation coefficient (R) of 0.343 and weighted average of 92.5%, a difference of 4.1%.
7th Grade Correlation Summary
| Measurement | Hopi | Immigrants from Honduras |
| Minimum | 86.4% | 68.0% |
| Maximum | 100.0% | 100.0% |
| Range | 13.6% | 32.0% |
| Mean | 97.4% | 91.0% |
| Median | 98.6% | 91.6% |
| Interquartile 25% (IQ1) | 96.2% | 88.7% |
| Interquartile 75% (IQ3) | 99.9% | 93.5% |
| Interquartile Range (IQR) | 3.7% | 4.9% |
| Standard Deviation (Sample) | 3.1% | 5.9% |
| Standard Deviation (Population) | 3.0% | 5.9% |
Similar Demographics by 7th Grade
Demographics Similar to Hopi by 7th Grade
In terms of 7th grade, the demographic groups most similar to Hopi are Israeli (96.3%, a difference of 0.010%), Albanian (96.3%, a difference of 0.010%), Immigrants from Belarus (96.3%, a difference of 0.010%), Immigrants from Eastern Europe (96.3%, a difference of 0.020%), and French American Indian (96.3%, a difference of 0.020%).
| Demographics | Rating | Rank | 7th Grade |
| Immigrants | Greece | 85.9 /100 | #144 | Excellent 96.3% |
| Blackfeet | 83.9 /100 | #145 | Excellent 96.3% |
| Immigrants | Eastern Europe | 83.7 /100 | #146 | Excellent 96.3% |
| French American Indians | 83.1 /100 | #147 | Excellent 96.3% |
| Israelis | 82.8 /100 | #148 | Excellent 96.3% |
| Albanians | 82.6 /100 | #149 | Excellent 96.3% |
| Immigrants | Belarus | 82.4 /100 | #150 | Excellent 96.3% |
| Hopi | 81.6 /100 | #151 | Excellent 96.3% |
| Immigrants | Russia | 78.4 /100 | #152 | Good 96.2% |
| Seminole | 78.1 /100 | #153 | Good 96.2% |
| Immigrants | Israel | 77.6 /100 | #154 | Good 96.2% |
| Immigrants | Jordan | 77.0 /100 | #155 | Good 96.2% |
| Kenyans | 76.2 /100 | #156 | Good 96.2% |
| Ugandans | 75.5 /100 | #157 | Good 96.2% |
| Arabs | 68.6 /100 | #158 | Good 96.2% |
Demographics Similar to Immigrants from Honduras by 7th Grade
In terms of 7th grade, the demographic groups most similar to Immigrants from Honduras are Mexican American Indian (92.6%, a difference of 0.070%), Immigrants from Yemen (92.6%, a difference of 0.17%), Immigrants from Armenia (92.7%, a difference of 0.25%), Hispanic or Latino (92.7%, a difference of 0.27%), and Immigrants from Latin America (92.2%, a difference of 0.27%).
| Demographics | Rating | Rank | 7th Grade |
| Immigrants | Azores | 0.0 /100 | #329 | Tragic 93.0% |
| Immigrants | Dominican Republic | 0.0 /100 | #330 | Tragic 92.9% |
| Hondurans | 0.0 /100 | #331 | Tragic 92.9% |
| Hispanics or Latinos | 0.0 /100 | #332 | Tragic 92.7% |
| Immigrants | Armenia | 0.0 /100 | #333 | Tragic 92.7% |
| Immigrants | Yemen | 0.0 /100 | #334 | Tragic 92.6% |
| Mexican American Indians | 0.0 /100 | #335 | Tragic 92.6% |
| Immigrants | Honduras | 0.0 /100 | #336 | Tragic 92.5% |
| Immigrants | Latin America | 0.0 /100 | #337 | Tragic 92.2% |
| Central Americans | 0.0 /100 | #338 | Tragic 92.1% |
| Mexicans | 0.0 /100 | #339 | Tragic 91.9% |
| Yakama | 0.0 /100 | #340 | Tragic 91.7% |
| Guatemalans | 0.0 /100 | #341 | Tragic 91.7% |
| Salvadorans | 0.0 /100 | #342 | Tragic 91.5% |
| Immigrants | Guatemala | 0.0 /100 | #343 | Tragic 91.3% |