Thai vs Immigrants from Honduras 7th Grade
COMPARE
Thai
Immigrants from Honduras
7th Grade
7th Grade Comparison
Thais
Immigrants from Honduras
96.7%
7TH GRADE
98.6/ 100
METRIC RATING
101st/ 347
METRIC RANK
92.5%
7TH GRADE
0.0/ 100
METRIC RATING
336th/ 347
METRIC RANK
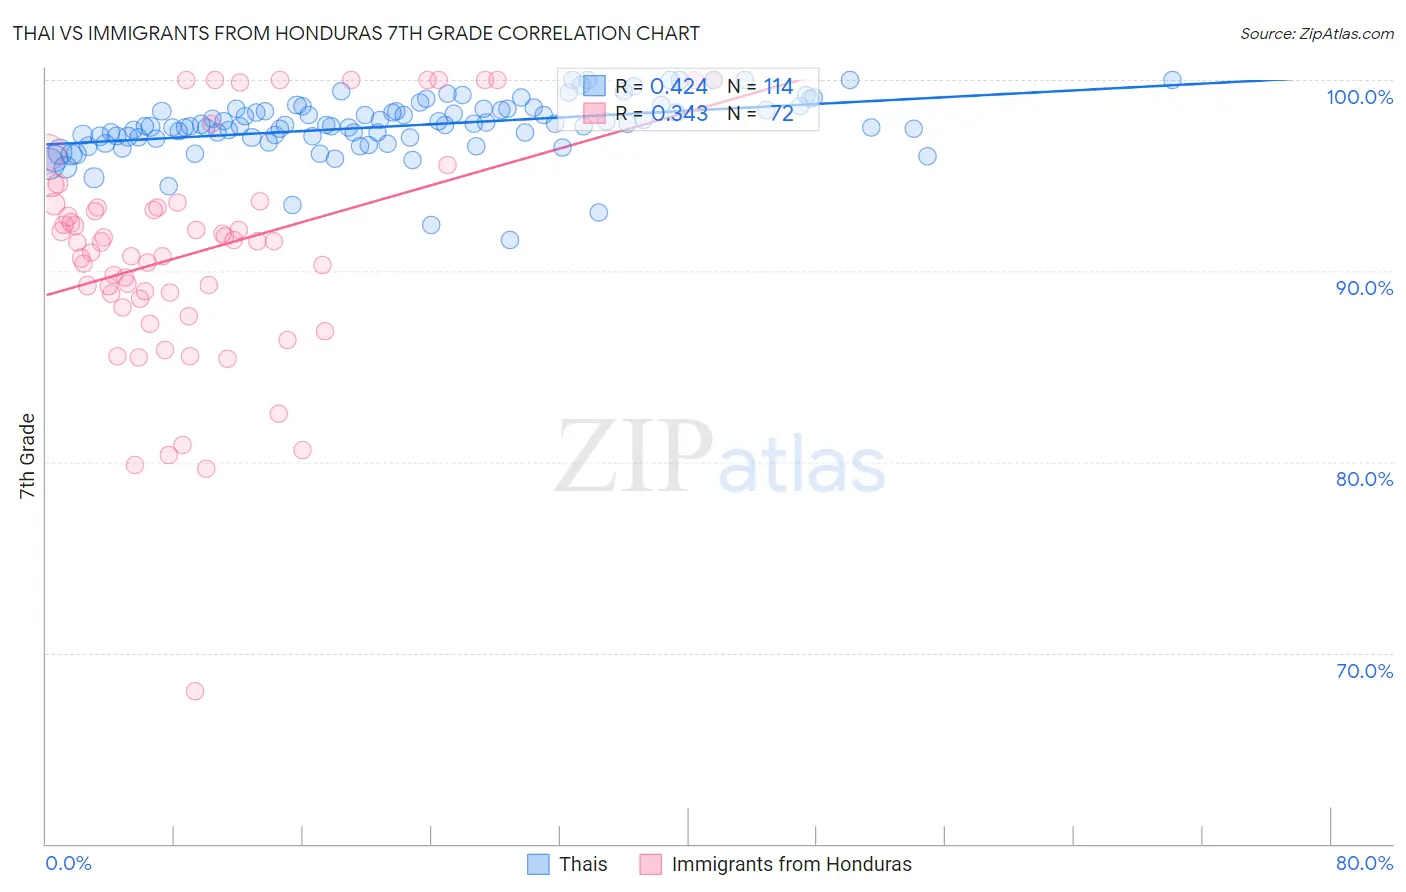
Thai vs Immigrants from Honduras 7th Grade Correlation Chart
The statistical analysis conducted on geographies consisting of 475,814,962 people shows a moderate positive correlation between the proportion of Thais and percentage of population with at least 7th grade education in the United States with a correlation coefficient (R) of 0.424 and weighted average of 96.7%. Similarly, the statistical analysis conducted on geographies consisting of 322,637,445 people shows a mild positive correlation between the proportion of Immigrants from Honduras and percentage of population with at least 7th grade education in the United States with a correlation coefficient (R) of 0.343 and weighted average of 92.5%, a difference of 4.5%.
7th Grade Correlation Summary
| Measurement | Thai | Immigrants from Honduras |
| Minimum | 91.6% | 68.0% |
| Maximum | 100.0% | 100.0% |
| Range | 8.4% | 32.0% |
| Mean | 97.6% | 91.0% |
| Median | 97.6% | 91.6% |
| Interquartile 25% (IQ1) | 97.0% | 88.7% |
| Interquartile 75% (IQ3) | 98.5% | 93.5% |
| Interquartile Range (IQR) | 1.5% | 4.9% |
| Standard Deviation (Sample) | 1.5% | 5.9% |
| Standard Deviation (Population) | 1.5% | 5.9% |
Similar Demographics by 7th Grade
Demographics Similar to Thais by 7th Grade
In terms of 7th grade, the demographic groups most similar to Thais are German Russian (96.7%, a difference of 0.0%), Immigrants from Denmark (96.7%, a difference of 0.010%), Immigrants from Germany (96.7%, a difference of 0.010%), Immigrants from Sweden (96.7%, a difference of 0.010%), and Menominee (96.7%, a difference of 0.010%).
| Demographics | Rating | Rank | 7th Grade |
| Lebanese | 98.8 /100 | #94 | Exceptional 96.7% |
| Immigrants | Australia | 98.8 /100 | #95 | Exceptional 96.7% |
| Immigrants | Denmark | 98.7 /100 | #96 | Exceptional 96.7% |
| Immigrants | Germany | 98.7 /100 | #97 | Exceptional 96.7% |
| Immigrants | Sweden | 98.7 /100 | #98 | Exceptional 96.7% |
| Menominee | 98.7 /100 | #99 | Exceptional 96.7% |
| German Russians | 98.6 /100 | #100 | Exceptional 96.7% |
| Thais | 98.6 /100 | #101 | Exceptional 96.7% |
| Immigrants | Czechoslovakia | 98.3 /100 | #102 | Exceptional 96.6% |
| Immigrants | Singapore | 98.3 /100 | #103 | Exceptional 96.6% |
| Shoshone | 98.1 /100 | #104 | Exceptional 96.6% |
| South Africans | 98.0 /100 | #105 | Exceptional 96.6% |
| Iroquois | 97.9 /100 | #106 | Exceptional 96.6% |
| Lumbee | 97.8 /100 | #107 | Exceptional 96.6% |
| Immigrants | Saudi Arabia | 97.8 /100 | #108 | Exceptional 96.6% |
Demographics Similar to Immigrants from Honduras by 7th Grade
In terms of 7th grade, the demographic groups most similar to Immigrants from Honduras are Mexican American Indian (92.6%, a difference of 0.070%), Immigrants from Yemen (92.6%, a difference of 0.17%), Immigrants from Armenia (92.7%, a difference of 0.25%), Hispanic or Latino (92.7%, a difference of 0.27%), and Immigrants from Latin America (92.2%, a difference of 0.27%).
| Demographics | Rating | Rank | 7th Grade |
| Immigrants | Azores | 0.0 /100 | #329 | Tragic 93.0% |
| Immigrants | Dominican Republic | 0.0 /100 | #330 | Tragic 92.9% |
| Hondurans | 0.0 /100 | #331 | Tragic 92.9% |
| Hispanics or Latinos | 0.0 /100 | #332 | Tragic 92.7% |
| Immigrants | Armenia | 0.0 /100 | #333 | Tragic 92.7% |
| Immigrants | Yemen | 0.0 /100 | #334 | Tragic 92.6% |
| Mexican American Indians | 0.0 /100 | #335 | Tragic 92.6% |
| Immigrants | Honduras | 0.0 /100 | #336 | Tragic 92.5% |
| Immigrants | Latin America | 0.0 /100 | #337 | Tragic 92.2% |
| Central Americans | 0.0 /100 | #338 | Tragic 92.1% |
| Mexicans | 0.0 /100 | #339 | Tragic 91.9% |
| Yakama | 0.0 /100 | #340 | Tragic 91.7% |
| Guatemalans | 0.0 /100 | #341 | Tragic 91.7% |
| Salvadorans | 0.0 /100 | #342 | Tragic 91.5% |
| Immigrants | Guatemala | 0.0 /100 | #343 | Tragic 91.3% |