Senegalese vs Hopi 7th Grade
COMPARE
Senegalese
Hopi
7th Grade
7th Grade Comparison
Senegalese
Hopi
95.6%
7TH GRADE
4.0/ 100
METRIC RATING
231st/ 347
METRIC RANK
96.3%
7TH GRADE
81.6/ 100
METRIC RATING
151st/ 347
METRIC RANK
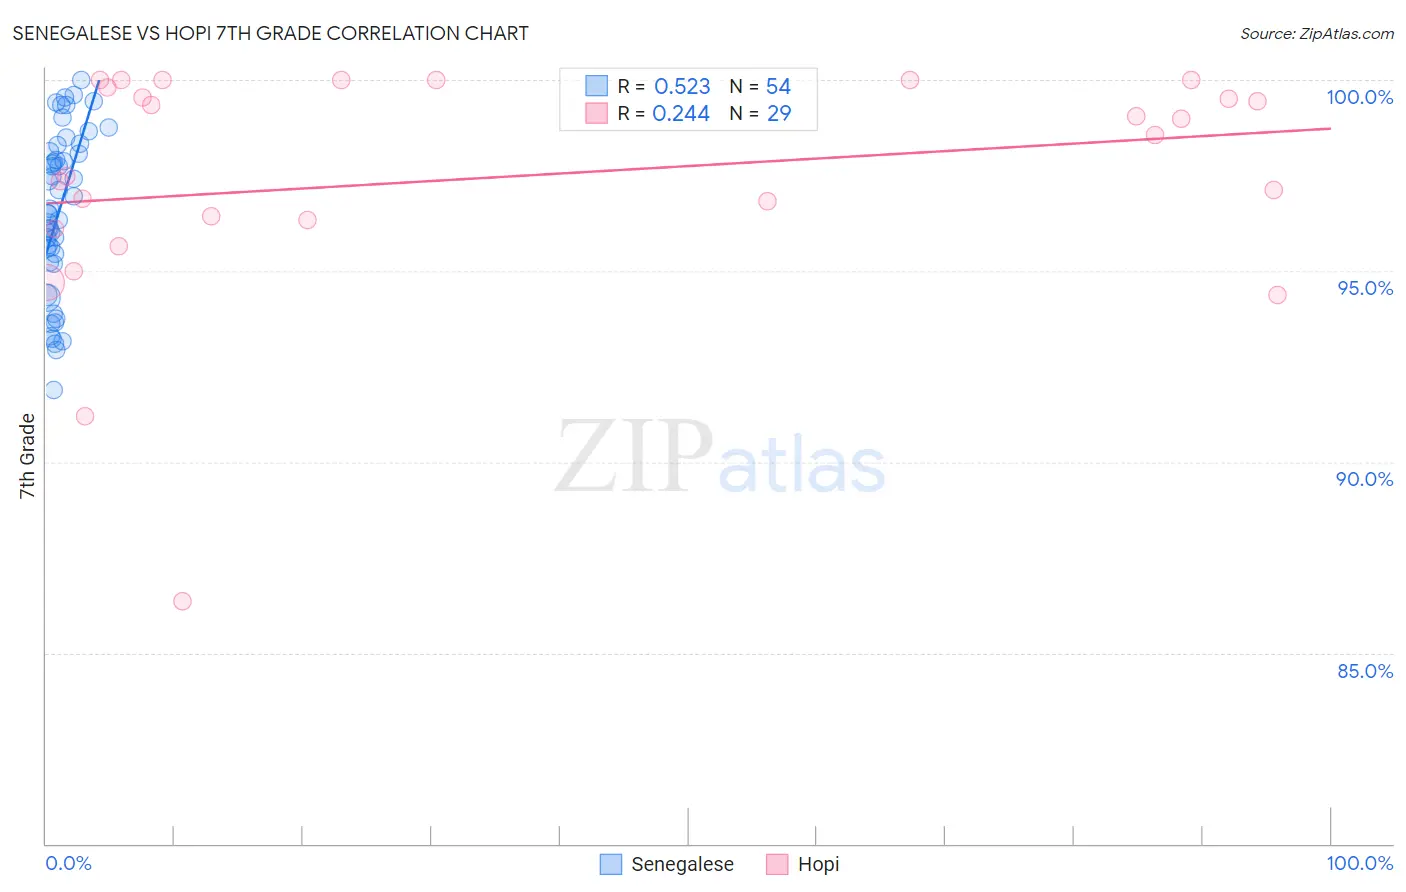
Senegalese vs Hopi 7th Grade Correlation Chart
The statistical analysis conducted on geographies consisting of 78,142,569 people shows a substantial positive correlation between the proportion of Senegalese and percentage of population with at least 7th grade education in the United States with a correlation coefficient (R) of 0.523 and weighted average of 95.6%. Similarly, the statistical analysis conducted on geographies consisting of 74,739,957 people shows a weak positive correlation between the proportion of Hopi and percentage of population with at least 7th grade education in the United States with a correlation coefficient (R) of 0.244 and weighted average of 96.3%, a difference of 0.72%.
7th Grade Correlation Summary
| Measurement | Senegalese | Hopi |
| Minimum | 91.9% | 86.4% |
| Maximum | 100.0% | 100.0% |
| Range | 8.1% | 13.6% |
| Mean | 96.5% | 97.4% |
| Median | 96.6% | 98.6% |
| Interquartile 25% (IQ1) | 95.2% | 96.2% |
| Interquartile 75% (IQ3) | 98.1% | 99.9% |
| Interquartile Range (IQR) | 2.9% | 3.7% |
| Standard Deviation (Sample) | 2.1% | 3.1% |
| Standard Deviation (Population) | 2.1% | 3.0% |
Similar Demographics by 7th Grade
Demographics Similar to Senegalese by 7th Grade
In terms of 7th grade, the demographic groups most similar to Senegalese are Native/Alaskan (95.6%, a difference of 0.010%), Immigrants from Panama (95.6%, a difference of 0.030%), Costa Rican (95.5%, a difference of 0.030%), Immigrants from Indonesia (95.5%, a difference of 0.030%), and Immigrants from Eastern Africa (95.6%, a difference of 0.040%).
| Demographics | Rating | Rank | 7th Grade |
| Immigrants | Oceania | 6.7 /100 | #224 | Tragic 95.7% |
| Immigrants | Malaysia | 6.2 /100 | #225 | Tragic 95.6% |
| Immigrants | Eastern Asia | 5.8 /100 | #226 | Tragic 95.6% |
| Immigrants | Western Asia | 5.4 /100 | #227 | Tragic 95.6% |
| Immigrants | Eastern Africa | 5.1 /100 | #228 | Tragic 95.6% |
| Immigrants | Panama | 4.9 /100 | #229 | Tragic 95.6% |
| Natives/Alaskans | 4.2 /100 | #230 | Tragic 95.6% |
| Senegalese | 4.0 /100 | #231 | Tragic 95.6% |
| Costa Ricans | 3.3 /100 | #232 | Tragic 95.5% |
| Immigrants | Indonesia | 3.3 /100 | #233 | Tragic 95.5% |
| Nigerians | 3.0 /100 | #234 | Tragic 95.5% |
| Immigrants | Africa | 2.7 /100 | #235 | Tragic 95.5% |
| Asians | 2.6 /100 | #236 | Tragic 95.5% |
| Immigrants | Asia | 2.3 /100 | #237 | Tragic 95.5% |
| Indians (Asian) | 2.3 /100 | #238 | Tragic 95.5% |
Demographics Similar to Hopi by 7th Grade
In terms of 7th grade, the demographic groups most similar to Hopi are Israeli (96.3%, a difference of 0.010%), Albanian (96.3%, a difference of 0.010%), Immigrants from Belarus (96.3%, a difference of 0.010%), Immigrants from Eastern Europe (96.3%, a difference of 0.020%), and French American Indian (96.3%, a difference of 0.020%).
| Demographics | Rating | Rank | 7th Grade |
| Immigrants | Greece | 85.9 /100 | #144 | Excellent 96.3% |
| Blackfeet | 83.9 /100 | #145 | Excellent 96.3% |
| Immigrants | Eastern Europe | 83.7 /100 | #146 | Excellent 96.3% |
| French American Indians | 83.1 /100 | #147 | Excellent 96.3% |
| Israelis | 82.8 /100 | #148 | Excellent 96.3% |
| Albanians | 82.6 /100 | #149 | Excellent 96.3% |
| Immigrants | Belarus | 82.4 /100 | #150 | Excellent 96.3% |
| Hopi | 81.6 /100 | #151 | Excellent 96.3% |
| Immigrants | Russia | 78.4 /100 | #152 | Good 96.2% |
| Seminole | 78.1 /100 | #153 | Good 96.2% |
| Immigrants | Israel | 77.6 /100 | #154 | Good 96.2% |
| Immigrants | Jordan | 77.0 /100 | #155 | Good 96.2% |
| Kenyans | 76.2 /100 | #156 | Good 96.2% |
| Ugandans | 75.5 /100 | #157 | Good 96.2% |
| Arabs | 68.6 /100 | #158 | Good 96.2% |