Senegalese vs Zimbabwean 9th Grade
COMPARE
Senegalese
Zimbabwean
9th Grade
9th Grade Comparison
Senegalese
Zimbabweans
94.2%
9TH GRADE
1.9/ 100
METRIC RATING
246th/ 347
METRIC RANK
95.9%
9TH GRADE
99.7/ 100
METRIC RATING
64th/ 347
METRIC RANK
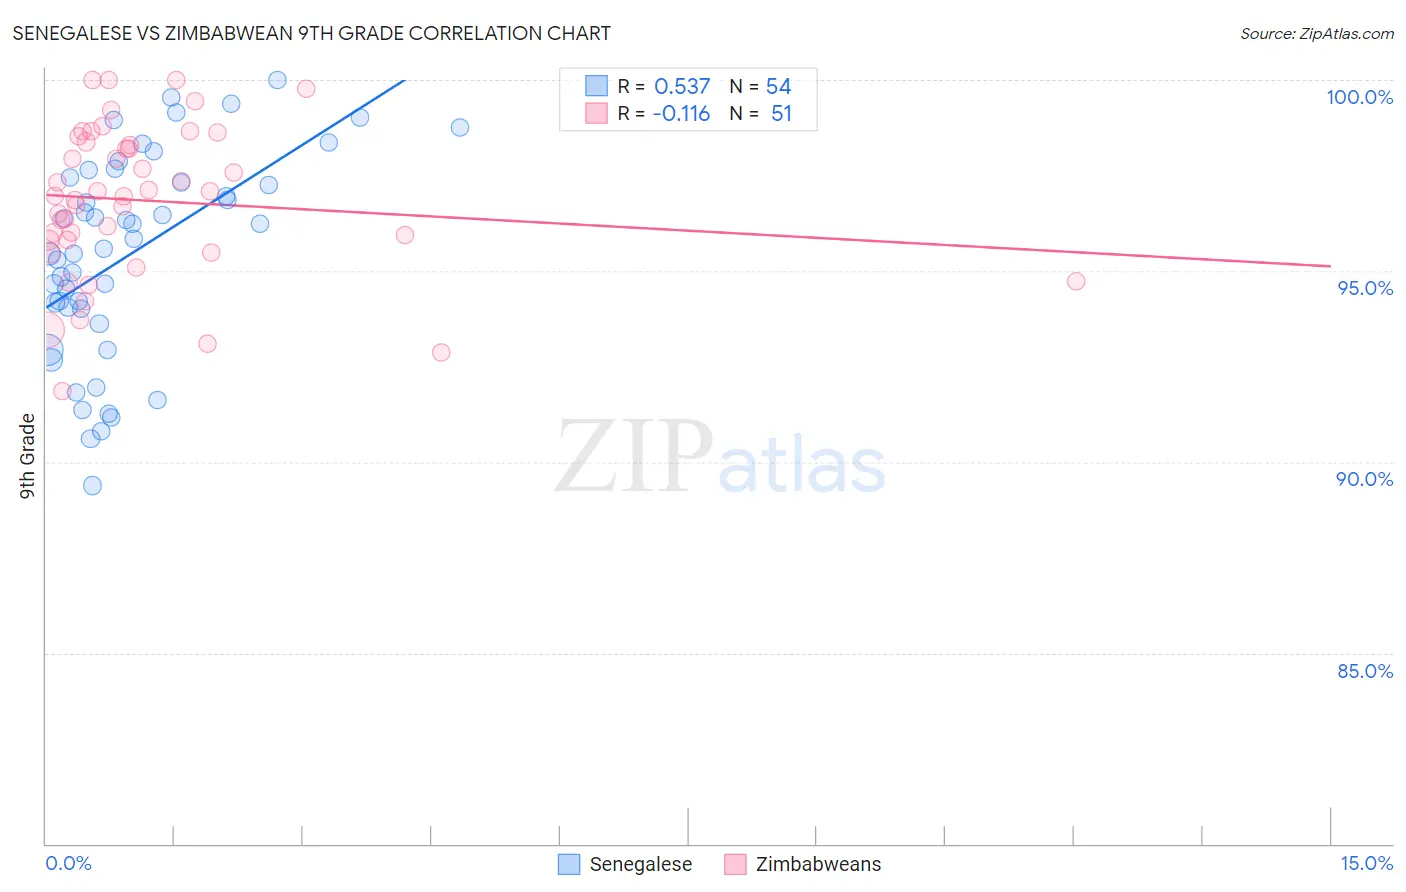
Senegalese vs Zimbabwean 9th Grade Correlation Chart
The statistical analysis conducted on geographies consisting of 78,142,569 people shows a substantial positive correlation between the proportion of Senegalese and percentage of population with at least 9th grade education in the United States with a correlation coefficient (R) of 0.537 and weighted average of 94.2%. Similarly, the statistical analysis conducted on geographies consisting of 69,203,423 people shows a poor negative correlation between the proportion of Zimbabweans and percentage of population with at least 9th grade education in the United States with a correlation coefficient (R) of -0.116 and weighted average of 95.9%, a difference of 1.8%.
9th Grade Correlation Summary
| Measurement | Senegalese | Zimbabwean |
| Minimum | 89.4% | 91.8% |
| Maximum | 100.0% | 100.0% |
| Range | 10.6% | 8.2% |
| Mean | 95.4% | 96.8% |
| Median | 95.7% | 97.0% |
| Interquartile 25% (IQ1) | 94.0% | 95.8% |
| Interquartile 75% (IQ3) | 97.5% | 98.4% |
| Interquartile Range (IQR) | 3.4% | 2.6% |
| Standard Deviation (Sample) | 2.7% | 2.0% |
| Standard Deviation (Population) | 2.6% | 1.9% |
Similar Demographics by 9th Grade
Demographics Similar to Senegalese by 9th Grade
In terms of 9th grade, the demographic groups most similar to Senegalese are Paiute (94.2%, a difference of 0.0%), Dutch West Indian (94.2%, a difference of 0.010%), Afghan (94.2%, a difference of 0.010%), Immigrants from Middle Africa (94.2%, a difference of 0.020%), and Immigrants from Cameroon (94.2%, a difference of 0.020%).
| Demographics | Rating | Rank | 9th Grade |
| Immigrants | China | 2.8 /100 | #239 | Tragic 94.3% |
| Immigrants | Ethiopia | 2.7 /100 | #240 | Tragic 94.3% |
| Spanish Americans | 2.6 /100 | #241 | Tragic 94.2% |
| Immigrants | Middle Africa | 2.2 /100 | #242 | Tragic 94.2% |
| Immigrants | Cameroon | 2.1 /100 | #243 | Tragic 94.2% |
| Dutch West Indians | 2.0 /100 | #244 | Tragic 94.2% |
| Paiute | 1.9 /100 | #245 | Tragic 94.2% |
| Senegalese | 1.9 /100 | #246 | Tragic 94.2% |
| Afghans | 1.8 /100 | #247 | Tragic 94.2% |
| Immigrants | Somalia | 1.4 /100 | #248 | Tragic 94.1% |
| Uruguayans | 1.3 /100 | #249 | Tragic 94.1% |
| Immigrants | Hong Kong | 1.3 /100 | #250 | Tragic 94.1% |
| Jamaicans | 1.0 /100 | #251 | Tragic 94.1% |
| Immigrants | Senegal | 0.9 /100 | #252 | Tragic 94.1% |
| Colombians | 0.8 /100 | #253 | Tragic 94.0% |
Demographics Similar to Zimbabweans by 9th Grade
In terms of 9th grade, the demographic groups most similar to Zimbabweans are Canadian (95.9%, a difference of 0.010%), Immigrants from England (95.9%, a difference of 0.010%), Immigrants from Netherlands (95.8%, a difference of 0.030%), Cypriot (95.8%, a difference of 0.030%), and Immigrants from Ireland (95.8%, a difference of 0.040%).
| Demographics | Rating | Rank | 9th Grade |
| Macedonians | 99.8 /100 | #57 | Exceptional 96.0% |
| Aleuts | 99.8 /100 | #58 | Exceptional 96.0% |
| New Zealanders | 99.8 /100 | #59 | Exceptional 95.9% |
| Native Hawaiians | 99.8 /100 | #60 | Exceptional 95.9% |
| Sioux | 99.8 /100 | #61 | Exceptional 95.9% |
| Ukrainians | 99.7 /100 | #62 | Exceptional 95.9% |
| Canadians | 99.7 /100 | #63 | Exceptional 95.9% |
| Zimbabweans | 99.7 /100 | #64 | Exceptional 95.9% |
| Immigrants | England | 99.6 /100 | #65 | Exceptional 95.9% |
| Immigrants | Netherlands | 99.6 /100 | #66 | Exceptional 95.8% |
| Cypriots | 99.6 /100 | #67 | Exceptional 95.8% |
| Immigrants | Ireland | 99.6 /100 | #68 | Exceptional 95.8% |
| Immigrants | Lithuania | 99.6 /100 | #69 | Exceptional 95.8% |
| Immigrants | Australia | 99.5 /100 | #70 | Exceptional 95.8% |
| Immigrants | Belgium | 99.5 /100 | #71 | Exceptional 95.8% |