Immigrants from Guyana vs Immigrants from Denmark Bachelor's Degree
COMPARE
Immigrants from Guyana
Immigrants from Denmark
Bachelor's Degree
Bachelor's Degree Comparison
Immigrants from Guyana
Immigrants from Denmark
33.9%
BACHELOR'S DEGREE
1.4/ 100
METRIC RATING
243rd/ 347
METRIC RANK
45.4%
BACHELOR'S DEGREE
100.0/ 100
METRIC RATING
34th/ 347
METRIC RANK
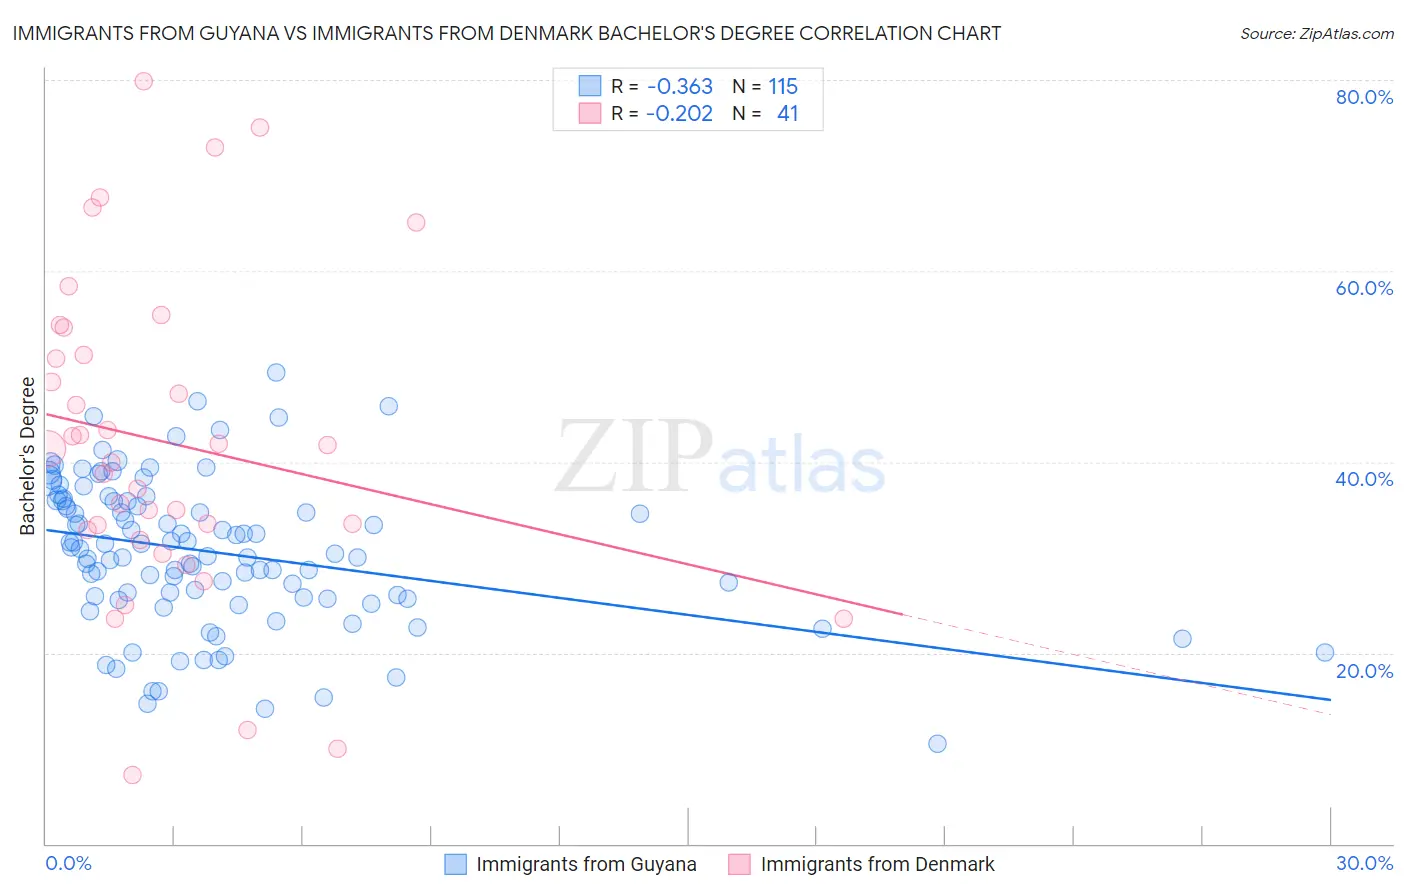
Immigrants from Guyana vs Immigrants from Denmark Bachelor's Degree Correlation Chart
The statistical analysis conducted on geographies consisting of 183,738,689 people shows a mild negative correlation between the proportion of Immigrants from Guyana and percentage of population with at least bachelor's degree education in the United States with a correlation coefficient (R) of -0.363 and weighted average of 33.9%. Similarly, the statistical analysis conducted on geographies consisting of 136,428,731 people shows a weak negative correlation between the proportion of Immigrants from Denmark and percentage of population with at least bachelor's degree education in the United States with a correlation coefficient (R) of -0.202 and weighted average of 45.4%, a difference of 33.8%.
Bachelor's Degree Correlation Summary
| Measurement | Immigrants from Guyana | Immigrants from Denmark |
| Minimum | 10.5% | 7.2% |
| Maximum | 49.4% | 79.9% |
| Range | 38.9% | 72.7% |
| Mean | 30.5% | 42.0% |
| Median | 31.0% | 41.3% |
| Interquartile 25% (IQ1) | 25.6% | 32.3% |
| Interquartile 75% (IQ3) | 36.0% | 52.7% |
| Interquartile Range (IQR) | 10.3% | 20.3% |
| Standard Deviation (Sample) | 7.7% | 16.9% |
| Standard Deviation (Population) | 7.7% | 16.7% |
Similar Demographics by Bachelor's Degree
Demographics Similar to Immigrants from Guyana by Bachelor's Degree
In terms of bachelor's degree, the demographic groups most similar to Immigrants from Guyana are Delaware (33.8%, a difference of 0.50%), Immigrants from Fiji (33.7%, a difference of 0.59%), Nonimmigrants (34.2%, a difference of 0.64%), Immigrants from Cambodia (34.2%, a difference of 0.71%), and Jamaican (33.6%, a difference of 0.96%).
| Demographics | Rating | Rank | Bachelor's Degree |
| Liberians | 2.8 /100 | #236 | Tragic 34.6% |
| Tlingit-Haida | 2.8 /100 | #237 | Tragic 34.6% |
| Guyanese | 2.5 /100 | #238 | Tragic 34.5% |
| British West Indians | 2.5 /100 | #239 | Tragic 34.5% |
| Tongans | 2.0 /100 | #240 | Tragic 34.3% |
| Immigrants | Cambodia | 1.9 /100 | #241 | Tragic 34.2% |
| Immigrants | Nonimmigrants | 1.8 /100 | #242 | Tragic 34.2% |
| Immigrants | Guyana | 1.4 /100 | #243 | Tragic 33.9% |
| Delaware | 1.2 /100 | #244 | Tragic 33.8% |
| Immigrants | Fiji | 1.2 /100 | #245 | Tragic 33.7% |
| Jamaicans | 1.0 /100 | #246 | Tragic 33.6% |
| Immigrants | Congo | 1.0 /100 | #247 | Tragic 33.6% |
| Cree | 1.0 /100 | #248 | Tragic 33.6% |
| Immigrants | Liberia | 0.9 /100 | #249 | Tragic 33.5% |
| Indonesians | 0.9 /100 | #250 | Tragic 33.5% |
Demographics Similar to Immigrants from Denmark by Bachelor's Degree
In terms of bachelor's degree, the demographic groups most similar to Immigrants from Denmark are Immigrants from Russia (45.4%, a difference of 0.030%), Mongolian (45.4%, a difference of 0.040%), Russian (45.3%, a difference of 0.19%), Bulgarian (45.3%, a difference of 0.28%), and Immigrants from Northern Europe (45.6%, a difference of 0.45%).
| Demographics | Rating | Rank | Bachelor's Degree |
| Immigrants | France | 100.0 /100 | #27 | Exceptional 46.4% |
| Turks | 100.0 /100 | #28 | Exceptional 46.2% |
| Israelis | 100.0 /100 | #29 | Exceptional 46.1% |
| Immigrants | Sri Lanka | 100.0 /100 | #30 | Exceptional 46.1% |
| Latvians | 100.0 /100 | #31 | Exceptional 46.1% |
| Immigrants | Turkey | 100.0 /100 | #32 | Exceptional 46.0% |
| Immigrants | Northern Europe | 100.0 /100 | #33 | Exceptional 45.6% |
| Immigrants | Denmark | 100.0 /100 | #34 | Exceptional 45.4% |
| Immigrants | Russia | 100.0 /100 | #35 | Exceptional 45.4% |
| Mongolians | 100.0 /100 | #36 | Exceptional 45.4% |
| Russians | 100.0 /100 | #37 | Exceptional 45.3% |
| Bulgarians | 100.0 /100 | #38 | Exceptional 45.3% |
| Immigrants | Latvia | 100.0 /100 | #39 | Exceptional 45.1% |
| Immigrants | Belarus | 100.0 /100 | #40 | Exceptional 45.0% |
| Immigrants | Malaysia | 100.0 /100 | #41 | Exceptional 45.0% |