Immigrants from Colombia vs Hmong College, Under 1 year
COMPARE
Immigrants from Colombia
Hmong
College, Under 1 year
College, Under 1 year Comparison
Immigrants from Colombia
Hmong
63.1%
COLLEGE, UNDER 1 YEAR
4.0/ 100
METRIC RATING
226th/ 347
METRIC RANK
63.5%
COLLEGE, UNDER 1 YEAR
6.8/ 100
METRIC RATING
216th/ 347
METRIC RANK
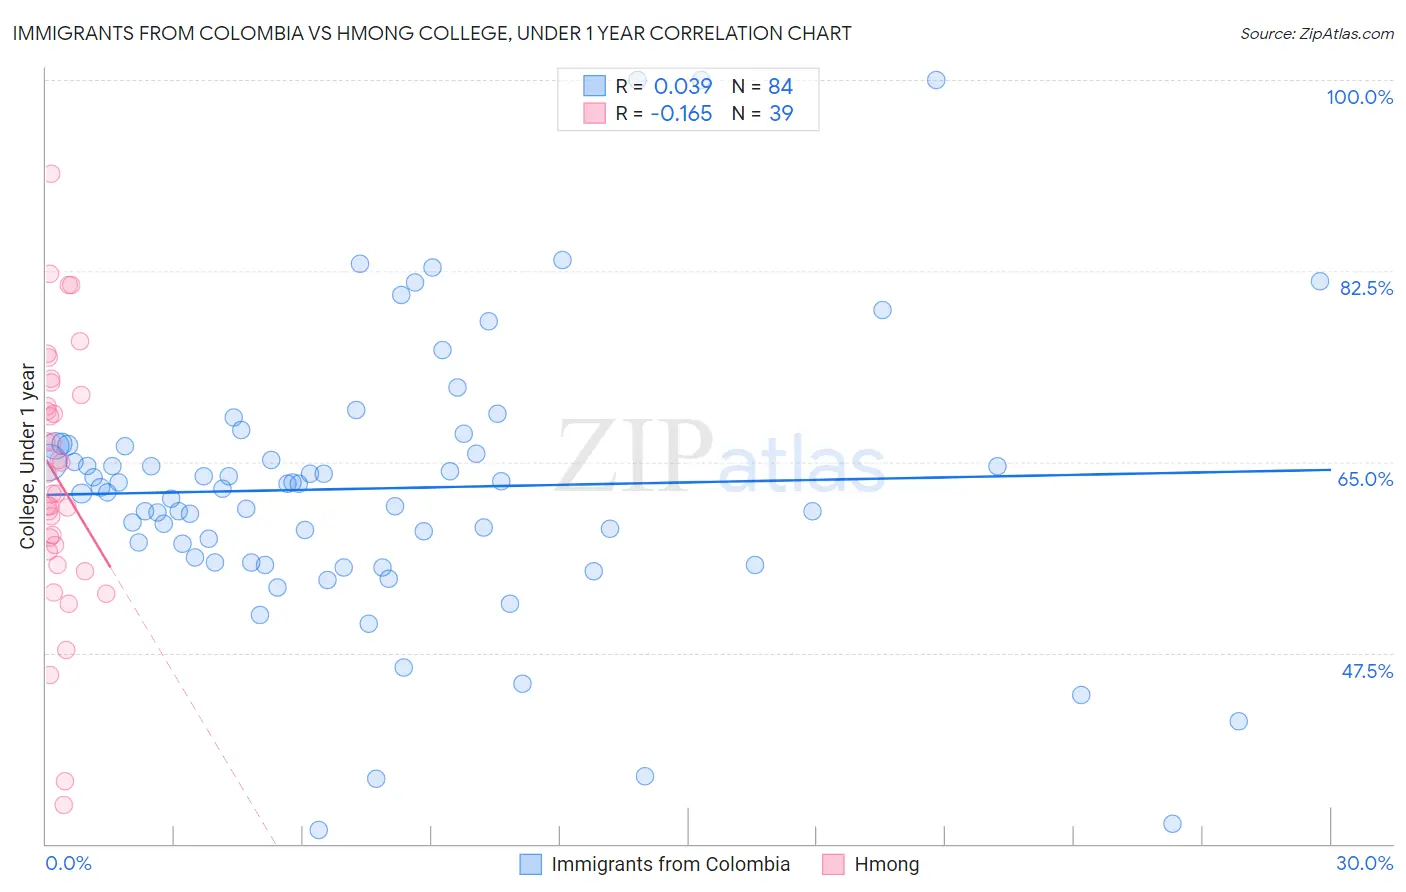
Immigrants from Colombia vs Hmong College, Under 1 year Correlation Chart
The statistical analysis conducted on geographies consisting of 378,689,260 people shows no correlation between the proportion of Immigrants from Colombia and percentage of population with at least college, under 1 year education in the United States with a correlation coefficient (R) of 0.039 and weighted average of 63.1%. Similarly, the statistical analysis conducted on geographies consisting of 24,680,511 people shows a poor negative correlation between the proportion of Hmong and percentage of population with at least college, under 1 year education in the United States with a correlation coefficient (R) of -0.165 and weighted average of 63.5%, a difference of 0.64%.
College, Under 1 year Correlation Summary
| Measurement | Immigrants from Colombia | Hmong |
| Minimum | 31.3% | 33.5% |
| Maximum | 100.0% | 91.4% |
| Range | 68.7% | 57.8% |
| Mean | 62.6% | 63.4% |
| Median | 62.6% | 62.1% |
| Interquartile 25% (IQ1) | 56.0% | 56.8% |
| Interquartile 75% (IQ3) | 66.5% | 71.1% |
| Interquartile Range (IQR) | 10.4% | 14.3% |
| Standard Deviation (Sample) | 12.8% | 12.0% |
| Standard Deviation (Population) | 12.7% | 11.8% |
Demographics Similar to Immigrants from Colombia and Hmong by College, Under 1 year
In terms of college, under 1 year, the demographic groups most similar to Immigrants from Colombia are Immigrants from Peru (63.1%, a difference of 0.020%), Immigrants from Ghana (63.1%, a difference of 0.090%), Subsaharan African (63.2%, a difference of 0.12%), Immigrants from Costa Rica (63.2%, a difference of 0.15%), and Samoan (63.0%, a difference of 0.20%). Similarly, the demographic groups most similar to Hmong are Senegalese (63.6%, a difference of 0.15%), Immigrants from Uruguay (63.4%, a difference of 0.19%), Immigrants from Panama (63.4%, a difference of 0.21%), Immigrants from Fiji (63.4%, a difference of 0.22%), and Portuguese (63.4%, a difference of 0.24%).
| Demographics | Rating | Rank | College, Under 1 year |
| Native Hawaiians | 10.6 /100 | #211 | Poor 63.9% |
| Immigrants | Middle Africa | 10.5 /100 | #212 | Poor 63.9% |
| Immigrants | South America | 9.1 /100 | #213 | Tragic 63.8% |
| Immigrants | Nigeria | 8.8 /100 | #214 | Tragic 63.7% |
| Senegalese | 7.7 /100 | #215 | Tragic 63.6% |
| Hmong | 6.8 /100 | #216 | Tragic 63.5% |
| Immigrants | Uruguay | 5.8 /100 | #217 | Tragic 63.4% |
| Immigrants | Panama | 5.7 /100 | #218 | Tragic 63.4% |
| Immigrants | Fiji | 5.7 /100 | #219 | Tragic 63.4% |
| Portuguese | 5.6 /100 | #220 | Tragic 63.4% |
| Cree | 5.2 /100 | #221 | Tragic 63.3% |
| Immigrants | Senegal | 5.0 /100 | #222 | Tragic 63.3% |
| Immigrants | Costa Rica | 4.5 /100 | #223 | Tragic 63.2% |
| Sub-Saharan Africans | 4.4 /100 | #224 | Tragic 63.2% |
| Immigrants | Peru | 4.0 /100 | #225 | Tragic 63.1% |
| Immigrants | Colombia | 4.0 /100 | #226 | Tragic 63.1% |
| Immigrants | Ghana | 3.7 /100 | #227 | Tragic 63.1% |
| Samoans | 3.3 /100 | #228 | Tragic 63.0% |
| Liberians | 3.2 /100 | #229 | Tragic 63.0% |
| Immigrants | Nonimmigrants | 3.0 /100 | #230 | Tragic 62.9% |
| Immigrants | Western Africa | 2.4 /100 | #231 | Tragic 62.8% |