Immigrants from Turkey vs Guatemalan 5th Grade
COMPARE
Immigrants from Turkey
Guatemalan
5th Grade
5th Grade Comparison
Immigrants from Turkey
Guatemalans
97.5%
5TH GRADE
86.7/ 100
METRIC RATING
139th/ 347
METRIC RANK
94.8%
5TH GRADE
0.0/ 100
METRIC RATING
340th/ 347
METRIC RANK
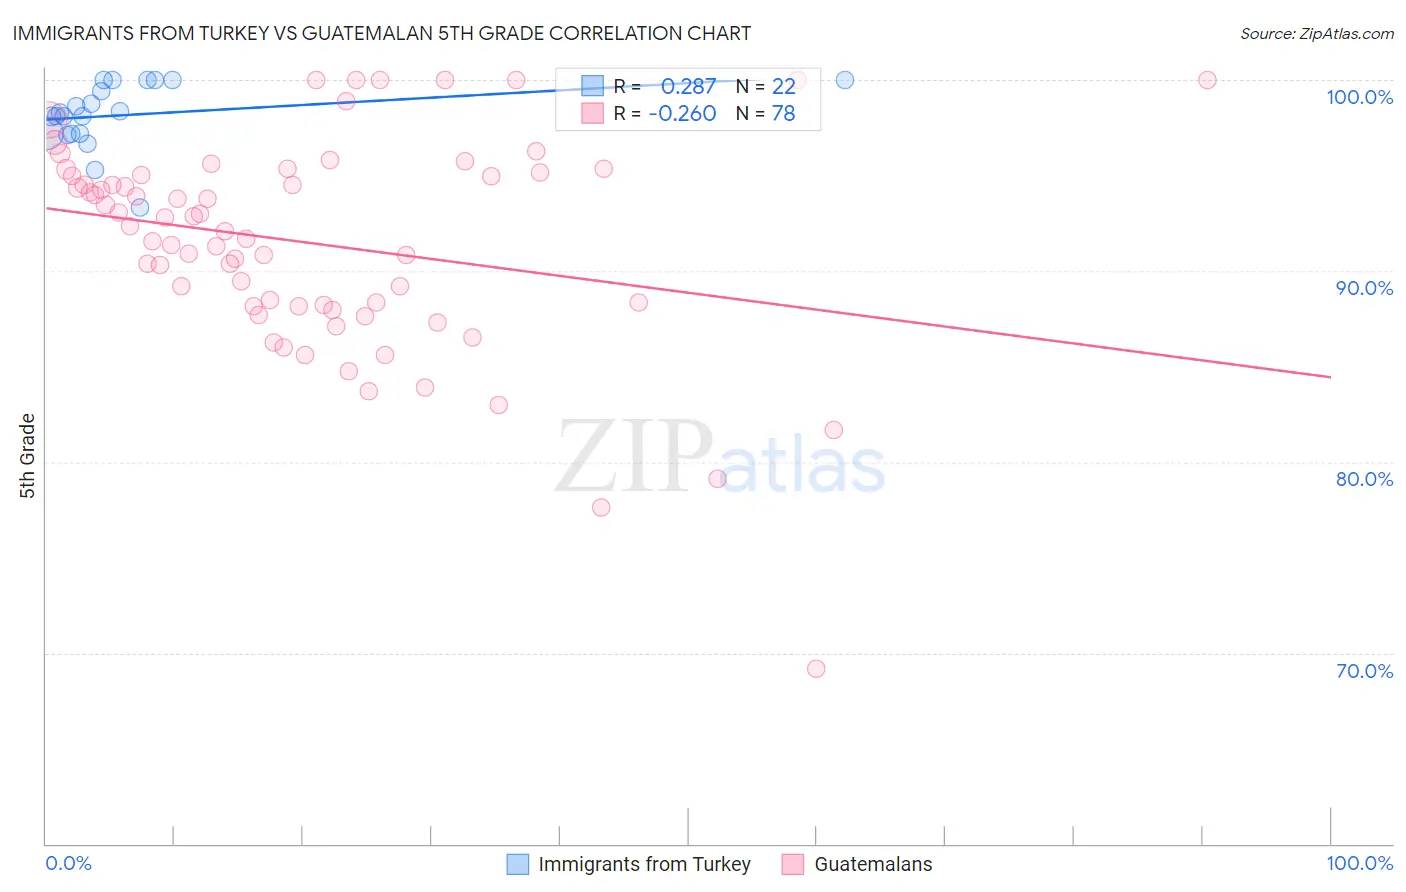
Immigrants from Turkey vs Guatemalan 5th Grade Correlation Chart
The statistical analysis conducted on geographies consisting of 223,057,877 people shows a weak positive correlation between the proportion of Immigrants from Turkey and percentage of population with at least 5th grade education in the United States with a correlation coefficient (R) of 0.287 and weighted average of 97.5%. Similarly, the statistical analysis conducted on geographies consisting of 409,566,469 people shows a weak negative correlation between the proportion of Guatemalans and percentage of population with at least 5th grade education in the United States with a correlation coefficient (R) of -0.260 and weighted average of 94.8%, a difference of 2.8%.
5th Grade Correlation Summary
| Measurement | Immigrants from Turkey | Guatemalan |
| Minimum | 93.3% | 69.2% |
| Maximum | 100.0% | 100.0% |
| Range | 6.7% | 30.8% |
| Mean | 98.2% | 91.5% |
| Median | 98.2% | 92.2% |
| Interquartile 25% (IQ1) | 97.2% | 88.2% |
| Interquartile 75% (IQ3) | 100.0% | 95.0% |
| Interquartile Range (IQR) | 2.8% | 6.8% |
| Standard Deviation (Sample) | 1.7% | 5.6% |
| Standard Deviation (Population) | 1.7% | 5.6% |
Similar Demographics by 5th Grade
Demographics Similar to Immigrants from Turkey by 5th Grade
In terms of 5th grade, the demographic groups most similar to Immigrants from Turkey are Filipino (97.5%, a difference of 0.0%), Blackfeet (97.5%, a difference of 0.0%), Immigrants from Moldova (97.5%, a difference of 0.010%), Burmese (97.5%, a difference of 0.010%), and Seminole (97.5%, a difference of 0.010%).
| Demographics | Rating | Rank | 5th Grade |
| Immigrants | Kuwait | 90.4 /100 | #132 | Exceptional 97.6% |
| Cambodians | 90.2 /100 | #133 | Exceptional 97.6% |
| Immigrants | Hungary | 90.1 /100 | #134 | Exceptional 97.6% |
| Palestinians | 89.3 /100 | #135 | Excellent 97.5% |
| Immigrants | Moldova | 87.5 /100 | #136 | Excellent 97.5% |
| Filipinos | 86.8 /100 | #137 | Excellent 97.5% |
| Blackfeet | 86.8 /100 | #138 | Excellent 97.5% |
| Immigrants | Turkey | 86.7 /100 | #139 | Excellent 97.5% |
| Burmese | 86.1 /100 | #140 | Excellent 97.5% |
| Seminole | 85.8 /100 | #141 | Excellent 97.5% |
| Israelis | 85.5 /100 | #142 | Excellent 97.5% |
| Immigrants | North Macedonia | 85.4 /100 | #143 | Excellent 97.5% |
| Immigrants | Greece | 83.2 /100 | #144 | Excellent 97.5% |
| Jordanians | 82.6 /100 | #145 | Excellent 97.5% |
| Spaniards | 81.9 /100 | #146 | Excellent 97.5% |
Demographics Similar to Guatemalans by 5th Grade
In terms of 5th grade, the demographic groups most similar to Guatemalans are Immigrants from Yemen (94.9%, a difference of 0.030%), Immigrants from Cabo Verde (94.9%, a difference of 0.070%), Yakama (94.8%, a difference of 0.080%), Immigrants from Central America (94.7%, a difference of 0.18%), and Central American (95.1%, a difference of 0.23%).
| Demographics | Rating | Rank | 5th Grade |
| Immigrants | Latin America | 0.0 /100 | #333 | Tragic 95.3% |
| Nepalese | 0.0 /100 | #334 | Tragic 95.2% |
| Mexicans | 0.0 /100 | #335 | Tragic 95.2% |
| Immigrants | Azores | 0.0 /100 | #336 | Tragic 95.1% |
| Central Americans | 0.0 /100 | #337 | Tragic 95.1% |
| Immigrants | Cabo Verde | 0.0 /100 | #338 | Tragic 94.9% |
| Immigrants | Yemen | 0.0 /100 | #339 | Tragic 94.9% |
| Guatemalans | 0.0 /100 | #340 | Tragic 94.8% |
| Yakama | 0.0 /100 | #341 | Tragic 94.8% |
| Immigrants | Central America | 0.0 /100 | #342 | Tragic 94.7% |
| Salvadorans | 0.0 /100 | #343 | Tragic 94.6% |
| Immigrants | Mexico | 0.0 /100 | #344 | Tragic 94.6% |
| Immigrants | Guatemala | 0.0 /100 | #345 | Tragic 94.6% |
| Immigrants | El Salvador | 0.0 /100 | #346 | Tragic 94.3% |
| Spanish American Indians | 0.0 /100 | #347 | Tragic 94.2% |