Colombian vs Creek 8th Grade

COMPARE

Colombian
Race
Ancestry
AfghanAfricanAlaska NativeAlaskan AthabascanAlbanianAleutAlsatianAmericanApacheArabArapahoArgentineanArmenianAssyrian/Chaldean/SyriacAustralianAustrianBahamianBangladeshiBarbadianBasqueBelgianBelizeanBermudanBhutaneseBlackfeetBolivianBrazilianBritishBritish West IndianBulgarianBurmeseCajunCambodianCanadianCape VerdeanCarpatho RusynCelticCentral AmericanCentral American IndianCherokeeCheyenneChickasawChileanChineseChippewaChoctawColombianColvilleComancheCosta RicanCreeCroatianCrowCubanCypriotCzechCzechoslovakianDanishDelawareDominicanDutchDutch West IndianEastern EuropeanEcuadorianEgyptianEnglishEstonianEthiopianEuropeanFijianFilipinoFinnishFrenchFrench American IndianFrench CanadianGermanGerman RussianGhanaianGreekGuamanian/ChamorroGuatemalanGuyaneseHaitianHmongHonduranHopiHoumaHungarianIcelanderIndian (Asian)IndonesianInupiatIranianIraqiIrishIroquoisIsraeliItalianJamaicanJapaneseJordanianKenyanKiowaKoreanLaotianLatvianLebaneseLiberianLithuanianLumbeeLuxembourgerMacedonianMalaysianMalteseMarshalleseMenomineeMexicanMexican American IndianMongolianMoroccanNative HawaiianNavajoNepaleseNew ZealanderNicaraguanNigerianNorthern EuropeanNorwegianOkinawanOsageOttawaPaiutePakistaniPalestinianPanamanianParaguayanPennsylvania GermanPeruvianPimaPolishPortuguesePotawatomiPuebloPuerto RicanPuget Sound SalishRomanianRussianSalvadoranSamoanScandinavianScotch-IrishScottishSeminoleSenegaleseSerbianShoshoneSierra LeoneanSiouxSlavicSlovakSloveneSomaliSouth AfricanSouth AmericanSouth American IndianSoviet UnionSpaniardSpanishSpanish AmericanSpanish American IndianSri LankanSubsaharan AfricanSudaneseSwedishSwissSyrianTaiwaneseThaiTlingit-HaidaTohono O'OdhamTonganTrinidadian and TobagonianTsimshianTurkishU.S. Virgin IslanderUgandanUkrainianUruguayanUteVenezuelanVietnameseWelshWest IndianYakamaYaquiYugoslavianYumanYup'ikZimbabwean
Immigration
NonimmigrantsImmigrantsAfghanistanAfricaAlbaniaArgentinaArmeniaAsiaAustraliaAustriaBahamasBangladeshBarbadosBelarusBelgiumBelizeBoliviaBosnia and HerzegovinaBrazilBulgariaBurma/MyanmarCabo VerdeCambodiaCameroonCanadaCaribbeanCentral AmericaChileChinaColombiaCongoCosta RicaCroatiaCubaCzechoslovakiaDenmarkDominicaDominican RepublicEastern AfricaEastern AsiaEastern EuropeEcuadorEgyptEl SalvadorEnglandEritreaEthiopiaEuropeFijiFranceGermanyGhanaGreeceGrenadaGuatemalaGuyanaHaitiHondurasHong KongHungaryIndiaIndonesiaIranIraqIrelandIsraelItalyJamaicaJapanJordanKazakhstanKenyaKoreaKuwaitLaosLatin AmericaLatviaLebanonLiberiaLithuaniaMalaysiaMexicoMicronesiaMiddle AfricaMoldovaMoroccoNepalNetherlandsNicaraguaNigeriaNorth AmericaNorth MacedoniaNorthern AfricaNorthern EuropeNorwayOceaniaPakistanPanamaPeruPhilippinesPolandPortugalRomaniaRussiaSaudi ArabiaScotlandSenegalSerbiaSierra LeoneSingaporeSomaliaSouth AfricaSouth AmericaSouth Central AsiaSouth Eastern AsiaSouthern EuropeSpainSri LankaSt. Vincent and the GrenadinesSudanSwedenSwitzerlandSyriaTaiwanThailandTrinidad and TobagoTurkeyUgandaUkraineUruguayUzbekistanVenezuelaVietnamWest IndiesWestern AfricaWestern AsiaWestern EuropeYemenZaireZimbabweAzores
Creek
Race
Ancestry
AfghanAfricanAlaska NativeAlaskan AthabascanAlbanianAleutAlsatianAmericanApacheArabArapahoArgentineanArmenianAssyrian/Chaldean/SyriacAustralianAustrianBahamianBangladeshiBarbadianBasqueBelgianBelizeanBermudanBhutaneseBlackfeetBolivianBrazilianBritishBritish West IndianBulgarianBurmeseCajunCambodianCanadianCape VerdeanCarpatho RusynCelticCentral AmericanCentral American IndianCherokeeCheyenneChickasawChileanChineseChippewaChoctawColvilleComancheCosta RicanCreeCreekCroatianCrowCubanCypriotCzechCzechoslovakianDanishDelawareDominicanDutchDutch West IndianEastern EuropeanEcuadorianEgyptianEnglishEstonianEthiopianEuropeanFijianFilipinoFinnishFrenchFrench American IndianFrench CanadianGermanGerman RussianGhanaianGreekGuamanian/ChamorroGuatemalanGuyaneseHaitianHmongHonduranHopiHoumaHungarianIcelanderIndian (Asian)IndonesianInupiatIranianIraqiIrishIroquoisIsraeliItalianJamaicanJapaneseJordanianKenyanKiowaKoreanLaotianLatvianLebaneseLiberianLithuanianLumbeeLuxembourgerMacedonianMalaysianMalteseMarshalleseMenomineeMexicanMexican American IndianMongolianMoroccanNative HawaiianNavajoNepaleseNew ZealanderNicaraguanNigerianNorthern EuropeanNorwegianOkinawanOsageOttawaPaiutePakistaniPalestinianPanamanianParaguayanPennsylvania GermanPeruvianPimaPolishPortuguesePotawatomiPuebloPuerto RicanPuget Sound SalishRomanianRussianSalvadoranSamoanScandinavianScotch-IrishScottishSeminoleSenegaleseSerbianShoshoneSierra LeoneanSiouxSlavicSlovakSloveneSomaliSouth AfricanSouth AmericanSouth American IndianSoviet UnionSpaniardSpanishSpanish AmericanSpanish American IndianSri LankanSubsaharan AfricanSudaneseSwedishSwissSyrianTaiwaneseThaiTlingit-HaidaTohono O'OdhamTonganTrinidadian and TobagonianTsimshianTurkishU.S. Virgin IslanderUgandanUkrainianUruguayanUteVenezuelanVietnameseWelshWest IndianYakamaYaquiYugoslavianYumanYup'ikZimbabwean
Immigration
NonimmigrantsImmigrantsAfghanistanAfricaAlbaniaArgentinaArmeniaAsiaAustraliaAustriaBahamasBangladeshBarbadosBelarusBelgiumBelizeBoliviaBosnia and HerzegovinaBrazilBulgariaBurma/MyanmarCabo VerdeCambodiaCameroonCanadaCaribbeanCentral AmericaChileChinaColombiaCongoCosta RicaCroatiaCubaCzechoslovakiaDenmarkDominicaDominican RepublicEastern AfricaEastern AsiaEastern EuropeEcuadorEgyptEl SalvadorEnglandEritreaEthiopiaEuropeFijiFranceGermanyGhanaGreeceGrenadaGuatemalaGuyanaHaitiHondurasHong KongHungaryIndiaIndonesiaIranIraqIrelandIsraelItalyJamaicaJapanJordanKazakhstanKenyaKoreaKuwaitLaosLatin AmericaLatviaLebanonLiberiaLithuaniaMalaysiaMexicoMicronesiaMiddle AfricaMoldovaMoroccoNepalNetherlandsNicaraguaNigeriaNorth AmericaNorth MacedoniaNorthern AfricaNorthern EuropeNorwayOceaniaPakistanPanamaPeruPhilippinesPolandPortugalRomaniaRussiaSaudi ArabiaScotlandSenegalSerbiaSierra LeoneSingaporeSomaliaSouth AfricaSouth AmericaSouth Central AsiaSouth Eastern AsiaSouthern EuropeSpainSri LankaSt. Vincent and the GrenadinesSudanSwedenSwitzerlandSyriaTaiwanThailandTrinidad and TobagoTurkeyUgandaUkraineUruguayUzbekistanVenezuelaVietnamWest IndiesWestern AfricaWestern AsiaWestern EuropeYemenZaireZimbabweAzores
8th Grade
Income
Poverty
Unemployment
Labor Participation
Family Structure
Vehicle Availability
Education Level
Disability

8th Grade Comparison

Colombians

Creek

Tragic
Exceptional
95.0%
8TH GRADE
0.7/ 100
METRIC RATING
256th/ 347
METRIC RANK
96.6%
8TH GRADE
99.7/ 100
METRIC RATING
68th/ 347
METRIC RANK

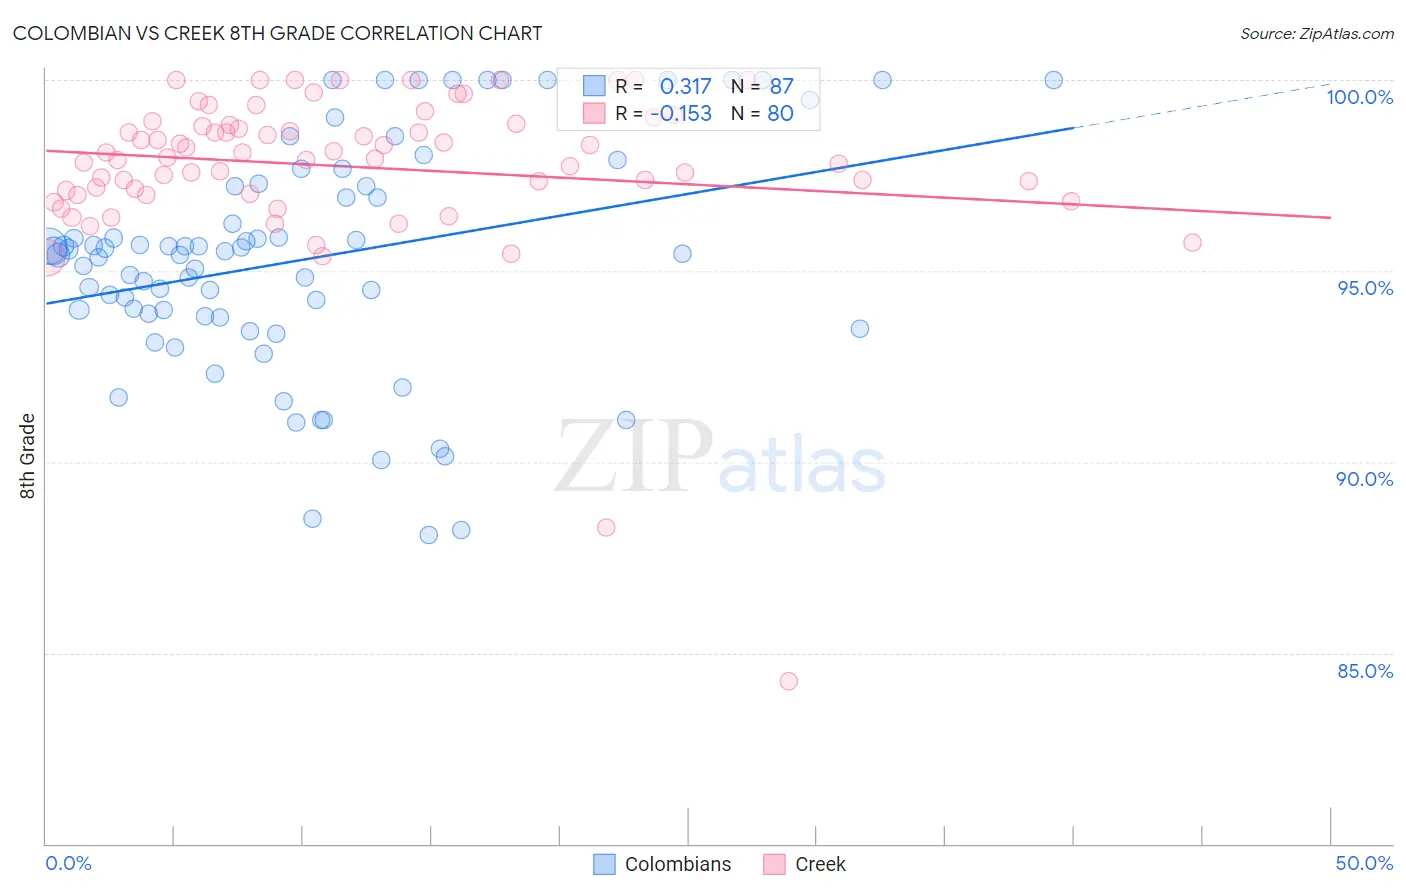
Colombian vs Creek 8th Grade Correlation Chart

The statistical analysis conducted on geographies consisting of 419,655,116 people shows a mild positive correlation between the proportion of Colombians and percentage of population with at least 8th grade education in the United States with a correlation coefficient (R) of 0.317 and weighted average of 95.0%. Similarly, the statistical analysis conducted on geographies consisting of 178,480,629 people shows a poor negative correlation between the proportion of Creek and percentage of population with at least 8th grade education in the United States with a correlation coefficient (R) of -0.153 and weighted average of 96.6%, a difference of 1.8%.
Colombian vs Creek 8th Grade

8th Grade Correlation Summary

MeasurementColombianCreek
Minimum88.1%84.3%
Maximum100.0%100.0%
Range11.9%15.7%
Mean95.3%97.7%
Median95.5%98.0%
Interquartile 25% (IQ1)93.8%97.1%
Interquartile 75% (IQ3)97.2%98.8%
Interquartile Range (IQR)3.4%1.8%
Standard Deviation (Sample)3.0%2.3%
Standard Deviation (Population)2.9%2.2%

Similar Demographics by 8th Grade

Demographics Similar to Colombians by 8th Grade

In terms of 8th grade, the demographic groups most similar to Colombians are Immigrants from Somalia (95.0%, a difference of 0.010%), Afghan (94.9%, a difference of 0.010%), Immigrants from Congo (94.9%, a difference of 0.020%), Ghanaian (94.9%, a difference of 0.020%), and Immigrants from Cameroon (95.0%, a difference of 0.030%).
DemographicsRating | Rank8th Grade
Immigrants | China
1.1
/100
|
#249
Tragic
95.0%
Koreans
1.1
/100
|
#250
Tragic
95.0%
Bolivians
1.0
/100
|
#251
Tragic
95.0%
Immigrants | Ethiopia
1.0
/100
|
#252
Tragic
95.0%
U.S. Virgin Islanders
0.9
/100
|
#253
Tragic
95.0%
Immigrants | Cameroon
0.8
/100
|
#254
Tragic
95.0%
Immigrants | Somalia
0.7
/100
|
#255
Tragic
95.0%
Colombians
0.7
/100
|
#256
Tragic
95.0%
Afghans
0.6
/100
|
#257
Tragic
94.9%
Immigrants | Congo
0.6
/100
|
#258
Tragic
94.9%
Ghanaians
0.6
/100
|
#259
Tragic
94.9%
Immigrants | Jamaica
0.6
/100
|
#260
Tragic
94.9%
Immigrants | Costa Rica
0.5
/100
|
#261
Tragic
94.9%
Immigrants | Nigeria
0.4
/100
|
#262
Tragic
94.9%
Immigrants | Hong Kong
0.4
/100
|
#263
Tragic
94.9%

Demographics Similar to Creek by 8th Grade

In terms of 8th grade, the demographic groups most similar to Creek are American (96.6%, a difference of 0.0%), Iranian (96.6%, a difference of 0.010%), Immigrants from India (96.6%, a difference of 0.020%), Native Hawaiian (96.6%, a difference of 0.020%), and Canadian (96.6%, a difference of 0.020%).
DemographicsRating | Rank8th Grade
Immigrants | Austria
99.8
/100
|
#61
Exceptional
96.7%
Whites/Caucasians
99.8
/100
|
#62
Exceptional
96.7%
Ukrainians
99.7
/100
|
#63
Exceptional
96.7%
Immigrants | India
99.7
/100
|
#64
Exceptional
96.6%
Native Hawaiians
99.7
/100
|
#65
Exceptional
96.6%
Canadians
99.7
/100
|
#66
Exceptional
96.6%
Iranians
99.7
/100
|
#67
Exceptional
96.6%
Creek
99.7
/100
|
#68
Exceptional
96.6%
Americans
99.7
/100
|
#69
Exceptional
96.6%
Immigrants | Lithuania
99.6
/100
|
#70
Exceptional
96.6%
New Zealanders
99.5
/100
|
#71
Exceptional
96.6%
Immigrants | England
99.5
/100
|
#72
Exceptional
96.6%
Arapaho
99.5
/100
|
#73
Exceptional
96.6%
Immigrants | Ireland
99.5
/100
|
#74
Exceptional
96.5%
Zimbabweans
99.4
/100
|
#75
Exceptional
96.5%