Senegalese vs Bahamian In Labor Force | Age 20-24
COMPARE
Senegalese
Bahamian
In Labor Force | Age 20-24
In Labor Force | Age 20-24 Comparison
Senegalese
Bahamians
74.8%
IN LABOR FORCE | AGE 20-24
28.1/ 100
METRIC RATING
191st/ 347
METRIC RANK
73.3%
IN LABOR FORCE | AGE 20-24
0.1/ 100
METRIC RATING
280th/ 347
METRIC RANK
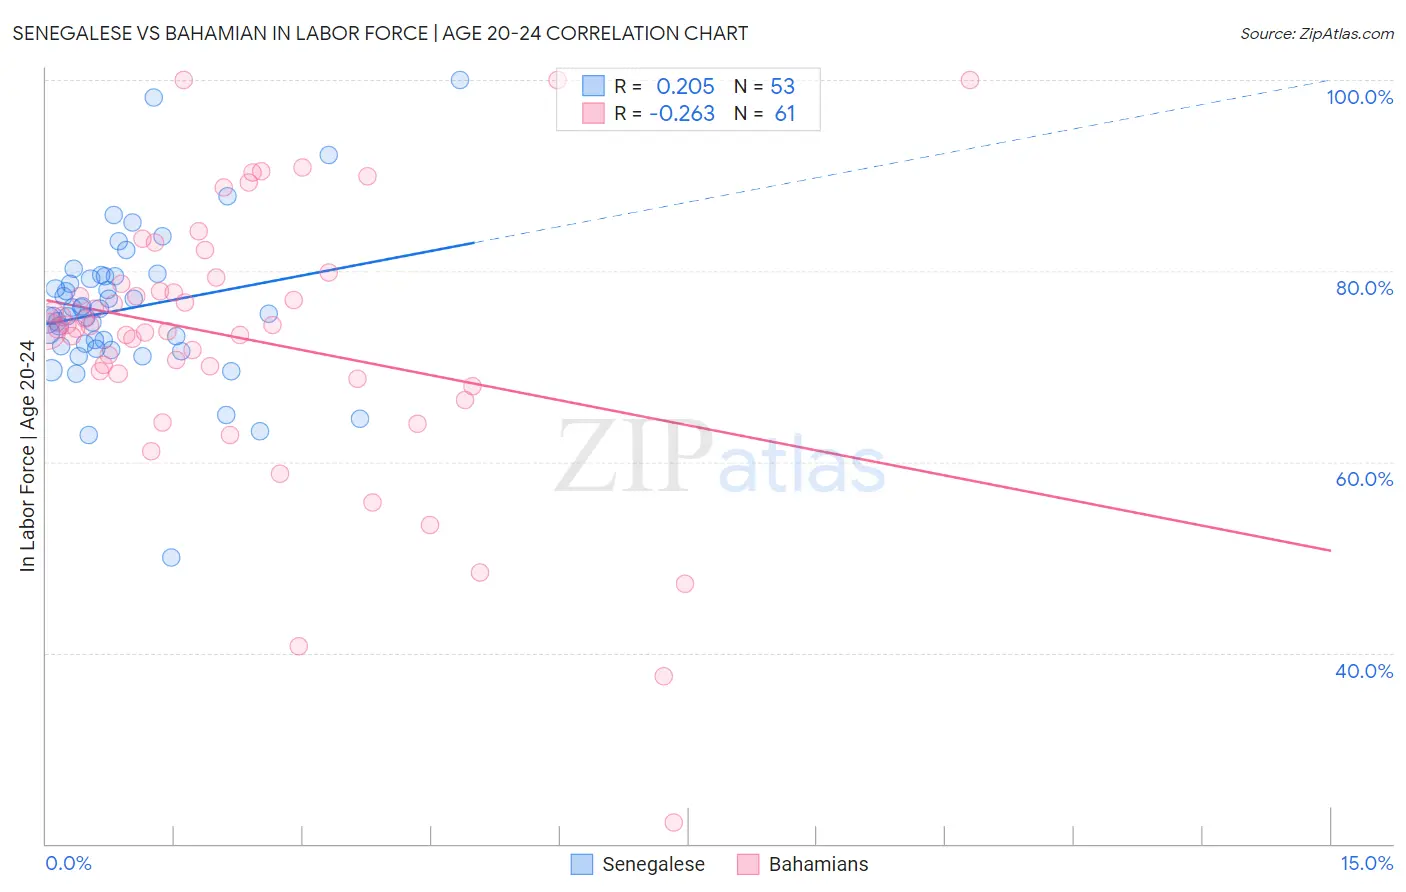
Senegalese vs Bahamian In Labor Force | Age 20-24 Correlation Chart
The statistical analysis conducted on geographies consisting of 78,141,567 people shows a weak positive correlation between the proportion of Senegalese and labor force participation rate among population between the ages 20 and 24 in the United States with a correlation coefficient (R) of 0.205 and weighted average of 74.8%. Similarly, the statistical analysis conducted on geographies consisting of 112,697,524 people shows a weak negative correlation between the proportion of Bahamians and labor force participation rate among population between the ages 20 and 24 in the United States with a correlation coefficient (R) of -0.263 and weighted average of 73.3%, a difference of 2.1%.
In Labor Force | Age 20-24 Correlation Summary
| Measurement | Senegalese | Bahamian |
| Minimum | 50.0% | 22.2% |
| Maximum | 100.0% | 100.0% |
| Range | 50.0% | 77.8% |
| Mean | 76.1% | 72.9% |
| Median | 75.5% | 74.0% |
| Interquartile 25% (IQ1) | 72.0% | 69.0% |
| Interquartile 75% (IQ3) | 79.4% | 79.0% |
| Interquartile Range (IQR) | 7.4% | 10.0% |
| Standard Deviation (Sample) | 8.2% | 14.3% |
| Standard Deviation (Population) | 8.1% | 14.1% |
Similar Demographics by In Labor Force | Age 20-24
Demographics Similar to Senegalese by In Labor Force | Age 20-24
In terms of in labor force | age 20-24, the demographic groups most similar to Senegalese are Immigrants from Europe (74.8%, a difference of 0.010%), Alsatian (74.8%, a difference of 0.020%), Immigrants from Denmark (74.8%, a difference of 0.040%), Eastern European (74.8%, a difference of 0.050%), and Immigrants from Vietnam (74.7%, a difference of 0.060%).
| Demographics | Rating | Rank | In Labor Force | Age 20-24 |
| Immigrants | Hungary | 35.0 /100 | #184 | Fair 74.9% |
| Sri Lankans | 34.9 /100 | #185 | Fair 74.9% |
| Immigrants | Eastern Europe | 33.8 /100 | #186 | Fair 74.9% |
| Immigrants | Honduras | 33.5 /100 | #187 | Fair 74.9% |
| Hondurans | 32.7 /100 | #188 | Fair 74.8% |
| Immigrants | Northern Europe | 32.6 /100 | #189 | Fair 74.8% |
| Russians | 32.2 /100 | #190 | Fair 74.8% |
| Senegalese | 28.1 /100 | #191 | Fair 74.8% |
| Immigrants | Europe | 27.5 /100 | #192 | Fair 74.8% |
| Alsatians | 27.1 /100 | #193 | Fair 74.8% |
| Immigrants | Denmark | 25.8 /100 | #194 | Fair 74.8% |
| Eastern Europeans | 25.4 /100 | #195 | Fair 74.8% |
| Immigrants | Vietnam | 25.1 /100 | #196 | Fair 74.7% |
| Panamanians | 25.0 /100 | #197 | Fair 74.7% |
| Immigrants | Nigeria | 24.2 /100 | #198 | Fair 74.7% |
Demographics Similar to Bahamians by In Labor Force | Age 20-24
In terms of in labor force | age 20-24, the demographic groups most similar to Bahamians are Immigrants from Venezuela (73.2%, a difference of 0.030%), Immigrants from Spain (73.2%, a difference of 0.040%), Immigrants from Bahamas (73.2%, a difference of 0.050%), Venezuelan (73.3%, a difference of 0.070%), and Kiowa (73.2%, a difference of 0.070%).
| Demographics | Rating | Rank | In Labor Force | Age 20-24 |
| Cheyenne | 0.2 /100 | #273 | Tragic 73.4% |
| Immigrants | Colombia | 0.2 /100 | #274 | Tragic 73.4% |
| Immigrants | South America | 0.2 /100 | #275 | Tragic 73.3% |
| Mongolians | 0.2 /100 | #276 | Tragic 73.3% |
| Immigrants | Malaysia | 0.2 /100 | #277 | Tragic 73.3% |
| Cypriots | 0.2 /100 | #278 | Tragic 73.3% |
| Venezuelans | 0.2 /100 | #279 | Tragic 73.3% |
| Bahamians | 0.1 /100 | #280 | Tragic 73.3% |
| Immigrants | Venezuela | 0.1 /100 | #281 | Tragic 73.2% |
| Immigrants | Spain | 0.1 /100 | #282 | Tragic 73.2% |
| Immigrants | Bahamas | 0.1 /100 | #283 | Tragic 73.2% |
| Kiowa | 0.1 /100 | #284 | Tragic 73.2% |
| Nicaraguans | 0.1 /100 | #285 | Tragic 73.2% |
| Immigrants | Lebanon | 0.1 /100 | #286 | Tragic 73.1% |
| Immigrants | Korea | 0.1 /100 | #287 | Tragic 73.1% |