Immigrants from Mexico vs Bahamian Doctorate Degree
COMPARE
Immigrants from Mexico
Bahamian
Doctorate Degree
Doctorate Degree Comparison
Immigrants from Mexico
Bahamians
1.1%
DOCTORATE DEGREE
0.0/ 100
METRIC RATING
344th/ 347
METRIC RANK
1.5%
DOCTORATE DEGREE
0.4/ 100
METRIC RATING
277th/ 347
METRIC RANK
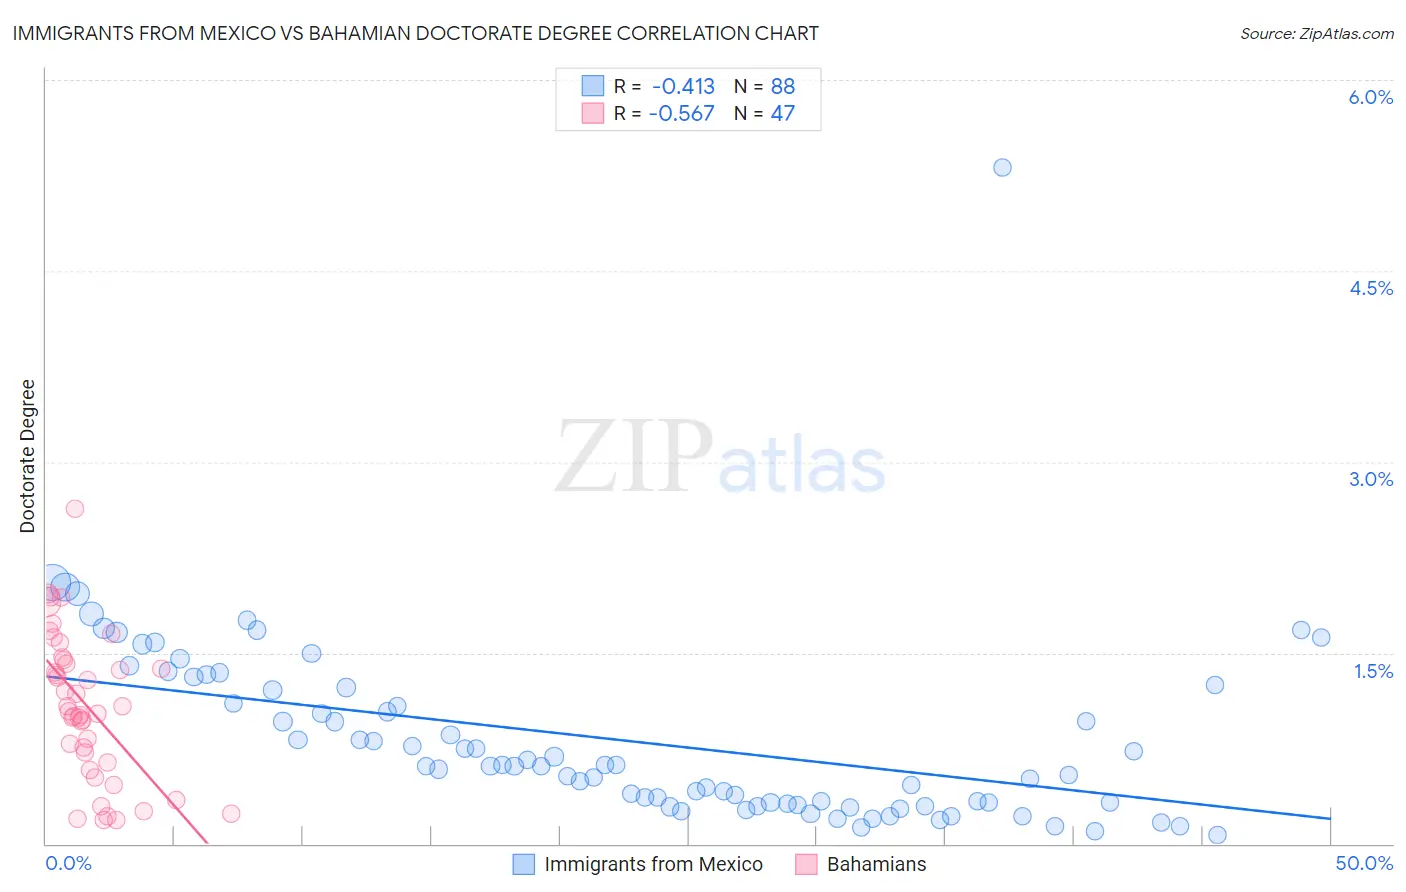
Immigrants from Mexico vs Bahamian Doctorate Degree Correlation Chart
The statistical analysis conducted on geographies consisting of 497,630,711 people shows a moderate negative correlation between the proportion of Immigrants from Mexico and percentage of population with at least doctorate degree education in the United States with a correlation coefficient (R) of -0.413 and weighted average of 1.1%. Similarly, the statistical analysis conducted on geographies consisting of 112,287,589 people shows a substantial negative correlation between the proportion of Bahamians and percentage of population with at least doctorate degree education in the United States with a correlation coefficient (R) of -0.567 and weighted average of 1.5%, a difference of 32.4%.
Doctorate Degree Correlation Summary
| Measurement | Immigrants from Mexico | Bahamian |
| Minimum | 0.070% | 0.18% |
| Maximum | 5.3% | 2.6% |
| Range | 5.2% | 2.5% |
| Mean | 0.81% | 1.1% |
| Median | 0.61% | 1.0% |
| Interquartile 25% (IQ1) | 0.32% | 0.64% |
| Interquartile 75% (IQ3) | 1.2% | 1.4% |
| Interquartile Range (IQR) | 0.90% | 0.80% |
| Standard Deviation (Sample) | 0.72% | 0.57% |
| Standard Deviation (Population) | 0.72% | 0.57% |
Similar Demographics by Doctorate Degree
Demographics Similar to Immigrants from Mexico by Doctorate Degree
In terms of doctorate degree, the demographic groups most similar to Immigrants from Mexico are Lumbee (1.1%, a difference of 1.5%), Fijian (1.1%, a difference of 2.1%), Spanish American Indian (1.1%, a difference of 4.4%), Arapaho (1.2%, a difference of 5.6%), and Mexican (1.2%, a difference of 5.9%).
| Demographics | Rating | Rank | Doctorate Degree |
| Immigrants | Caribbean | 0.0 /100 | #333 | Tragic 1.3% |
| Immigrants | Dominican Republic | 0.0 /100 | #334 | Tragic 1.3% |
| Immigrants | Haiti | 0.0 /100 | #335 | Tragic 1.3% |
| Nepalese | 0.0 /100 | #336 | Tragic 1.3% |
| Bangladeshis | 0.0 /100 | #337 | Tragic 1.2% |
| Puget Sound Salish | 0.0 /100 | #338 | Tragic 1.2% |
| Immigrants | Central America | 0.0 /100 | #339 | Tragic 1.2% |
| Immigrants | Cuba | 0.0 /100 | #340 | Tragic 1.2% |
| Mexicans | 0.0 /100 | #341 | Tragic 1.2% |
| Arapaho | 0.0 /100 | #342 | Tragic 1.2% |
| Fijians | 0.0 /100 | #343 | Tragic 1.1% |
| Immigrants | Mexico | 0.0 /100 | #344 | Tragic 1.1% |
| Lumbee | 0.0 /100 | #345 | Tragic 1.1% |
| Spanish American Indians | 0.0 /100 | #346 | Tragic 1.1% |
| Houma | 0.0 /100 | #347 | Tragic 0.96% |
Demographics Similar to Bahamians by Doctorate Degree
In terms of doctorate degree, the demographic groups most similar to Bahamians are Hawaiian (1.5%, a difference of 0.060%), Marshallese (1.5%, a difference of 0.28%), Ecuadorian (1.5%, a difference of 0.29%), Tohono O'odham (1.5%, a difference of 0.35%), and British West Indian (1.5%, a difference of 0.41%).
| Demographics | Rating | Rank | Doctorate Degree |
| Salvadorans | 0.5 /100 | #270 | Tragic 1.5% |
| Immigrants | Trinidad and Tobago | 0.5 /100 | #271 | Tragic 1.5% |
| Immigrants | Barbados | 0.4 /100 | #272 | Tragic 1.5% |
| Sioux | 0.4 /100 | #273 | Tragic 1.5% |
| Yaqui | 0.4 /100 | #274 | Tragic 1.5% |
| Aleuts | 0.4 /100 | #275 | Tragic 1.5% |
| Paiute | 0.4 /100 | #276 | Tragic 1.5% |
| Bahamians | 0.4 /100 | #277 | Tragic 1.5% |
| Hawaiians | 0.4 /100 | #278 | Tragic 1.5% |
| Marshallese | 0.4 /100 | #279 | Tragic 1.5% |
| Ecuadorians | 0.4 /100 | #280 | Tragic 1.5% |
| Tohono O'odham | 0.4 /100 | #281 | Tragic 1.5% |
| British West Indians | 0.3 /100 | #282 | Tragic 1.5% |
| Central Americans | 0.3 /100 | #283 | Tragic 1.5% |
| Jamaicans | 0.3 /100 | #284 | Tragic 1.5% |