Immigrants from Liberia vs Immigrants from Uruguay 3rd Grade
COMPARE
Immigrants from Liberia
Immigrants from Uruguay
3rd Grade
3rd Grade Comparison
Immigrants from Liberia
Immigrants from Uruguay
97.3%
3RD GRADE
0.5/ 100
METRIC RATING
258th/ 347
METRIC RANK
97.4%
3RD GRADE
1.7/ 100
METRIC RATING
238th/ 347
METRIC RANK
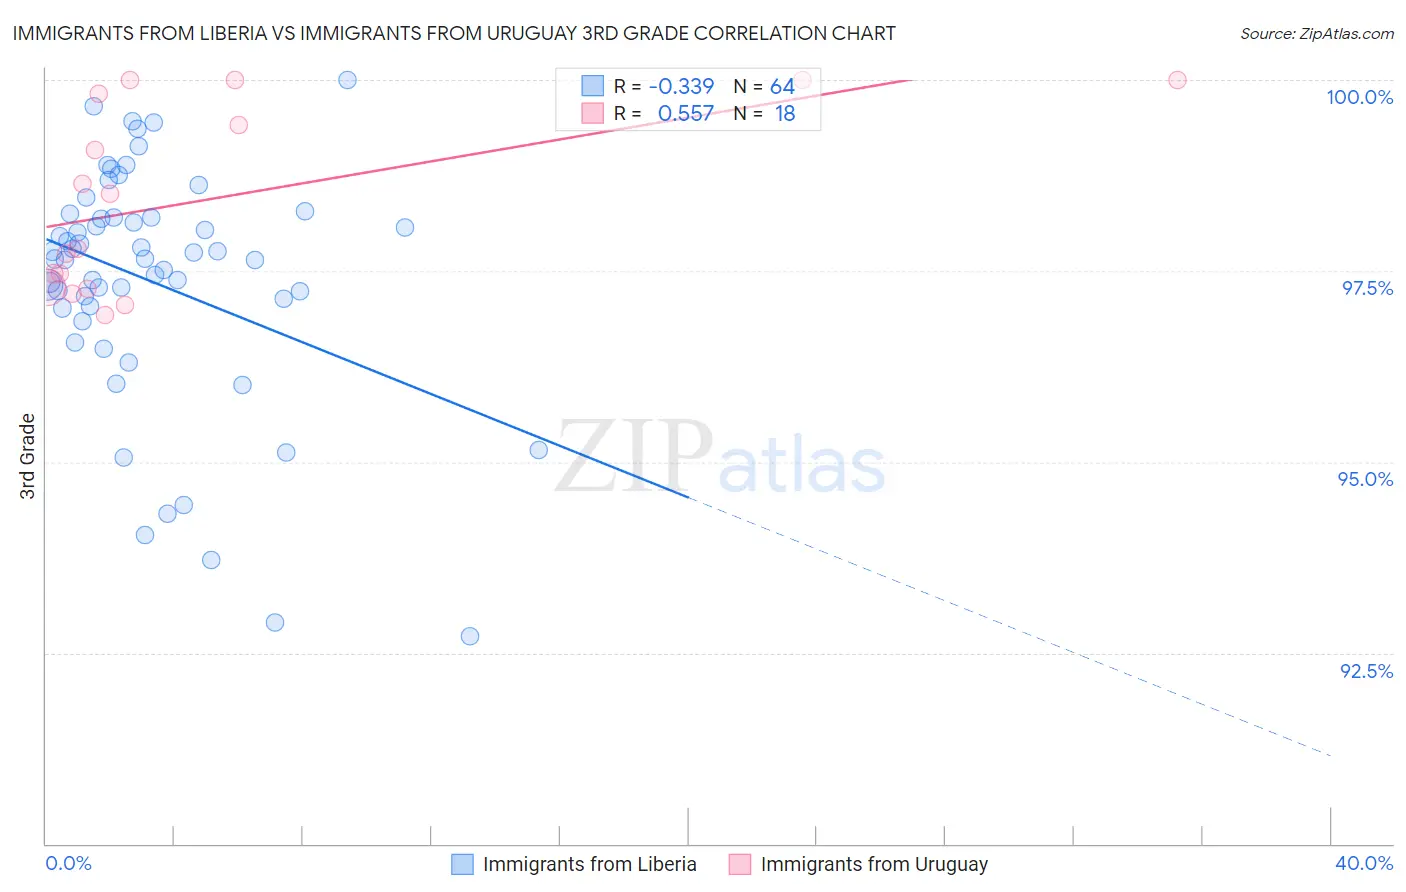
Immigrants from Liberia vs Immigrants from Uruguay 3rd Grade Correlation Chart
The statistical analysis conducted on geographies consisting of 135,294,272 people shows a mild negative correlation between the proportion of Immigrants from Liberia and percentage of population with at least 3rd grade education in the United States with a correlation coefficient (R) of -0.339 and weighted average of 97.3%. Similarly, the statistical analysis conducted on geographies consisting of 133,259,667 people shows a substantial positive correlation between the proportion of Immigrants from Uruguay and percentage of population with at least 3rd grade education in the United States with a correlation coefficient (R) of 0.557 and weighted average of 97.4%, a difference of 0.11%.
3rd Grade Correlation Summary
| Measurement | Immigrants from Liberia | Immigrants from Uruguay |
| Minimum | 92.7% | 96.9% |
| Maximum | 100.0% | 100.0% |
| Range | 7.3% | 3.1% |
| Mean | 97.3% | 98.4% |
| Median | 97.7% | 98.1% |
| Interquartile 25% (IQ1) | 97.0% | 97.3% |
| Interquartile 75% (IQ3) | 98.2% | 99.8% |
| Interquartile Range (IQR) | 1.2% | 2.5% |
| Standard Deviation (Sample) | 1.6% | 1.2% |
| Standard Deviation (Population) | 1.6% | 1.2% |
Demographics Similar to Immigrants from Liberia and Immigrants from Uruguay by 3rd Grade
In terms of 3rd grade, the demographic groups most similar to Immigrants from Liberia are Immigrants from Colombia (97.3%, a difference of 0.010%), Bolivian (97.3%, a difference of 0.020%), Immigrants from Congo (97.3%, a difference of 0.020%), Jamaican (97.4%, a difference of 0.040%), and Immigrants from Middle Africa (97.4%, a difference of 0.050%). Similarly, the demographic groups most similar to Immigrants from Uruguay are Nigerian (97.4%, a difference of 0.010%), U.S. Virgin Islander (97.4%, a difference of 0.010%), Immigrants from Indonesia (97.4%, a difference of 0.020%), Korean (97.4%, a difference of 0.020%), and Indian (Asian) (97.4%, a difference of 0.020%).
| Demographics | Rating | Rank | 3rd Grade |
| Immigrants | Uruguay | 1.7 /100 | #238 | Tragic 97.4% |
| Nigerians | 1.6 /100 | #239 | Tragic 97.4% |
| U.S. Virgin Islanders | 1.4 /100 | #240 | Tragic 97.4% |
| Immigrants | Indonesia | 1.4 /100 | #241 | Tragic 97.4% |
| Koreans | 1.3 /100 | #242 | Tragic 97.4% |
| Indians (Asian) | 1.3 /100 | #243 | Tragic 97.4% |
| Asians | 1.1 /100 | #244 | Tragic 97.4% |
| Ethiopians | 1.1 /100 | #245 | Tragic 97.4% |
| Immigrants | Senegal | 1.0 /100 | #246 | Tragic 97.4% |
| Assyrians/Chaldeans/Syriacs | 1.0 /100 | #247 | Tragic 97.4% |
| Immigrants | Eastern Africa | 0.9 /100 | #248 | Tragic 97.4% |
| South Americans | 0.9 /100 | #249 | Tragic 97.4% |
| Immigrants | Middle Africa | 0.9 /100 | #250 | Tragic 97.4% |
| Immigrants | Asia | 0.8 /100 | #251 | Tragic 97.4% |
| Peruvians | 0.8 /100 | #252 | Tragic 97.4% |
| Immigrants | Africa | 0.8 /100 | #253 | Tragic 97.4% |
| Jamaicans | 0.7 /100 | #254 | Tragic 97.4% |
| Bolivians | 0.6 /100 | #255 | Tragic 97.3% |
| Immigrants | Congo | 0.6 /100 | #256 | Tragic 97.3% |
| Immigrants | Colombia | 0.5 /100 | #257 | Tragic 97.3% |
| Immigrants | Liberia | 0.5 /100 | #258 | Tragic 97.3% |