Seminole vs Immigrants from Somalia No Schooling Completed
COMPARE
Seminole
Immigrants from Somalia
No Schooling Completed
No Schooling Completed Comparison
Seminole
Immigrants from Somalia
1.9%
NO SCHOOLING COMPLETED
92.0/ 100
METRIC RATING
129th/ 347
METRIC RANK
3.0%
NO SCHOOLING COMPLETED
0.0/ 100
METRIC RATING
308th/ 347
METRIC RANK
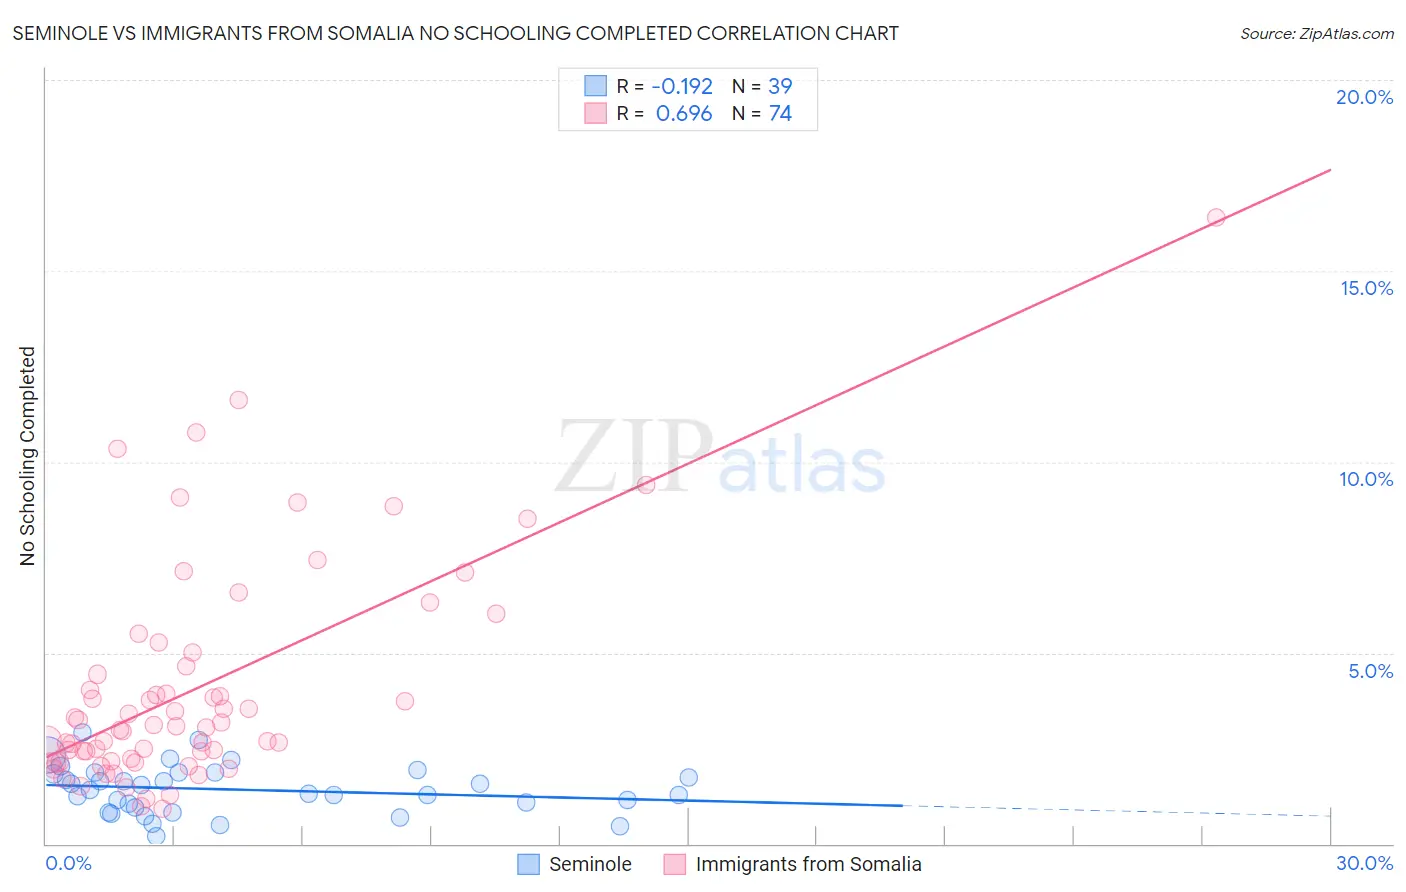
Seminole vs Immigrants from Somalia No Schooling Completed Correlation Chart
The statistical analysis conducted on geographies consisting of 117,813,139 people shows a poor negative correlation between the proportion of Seminole and percentage of population with no schooling in the United States with a correlation coefficient (R) of -0.192 and weighted average of 1.9%. Similarly, the statistical analysis conducted on geographies consisting of 92,035,757 people shows a significant positive correlation between the proportion of Immigrants from Somalia and percentage of population with no schooling in the United States with a correlation coefficient (R) of 0.696 and weighted average of 3.0%, a difference of 56.9%.
No Schooling Completed Correlation Summary
| Measurement | Seminole | Immigrants from Somalia |
| Minimum | 0.20% | 0.92% |
| Maximum | 2.9% | 16.4% |
| Range | 2.7% | 15.5% |
| Mean | 1.4% | 4.1% |
| Median | 1.4% | 3.0% |
| Interquartile 25% (IQ1) | 0.93% | 2.2% |
| Interquartile 75% (IQ3) | 1.9% | 4.6% |
| Interquartile Range (IQR) | 0.92% | 2.5% |
| Standard Deviation (Sample) | 0.62% | 2.9% |
| Standard Deviation (Population) | 0.62% | 2.9% |
Similar Demographics by No Schooling Completed
Demographics Similar to Seminole by No Schooling Completed
In terms of no schooling completed, the demographic groups most similar to Seminole are Palestinian (1.9%, a difference of 0.11%), Spaniard (1.9%, a difference of 0.14%), Immigrants from Hungary (1.9%, a difference of 0.21%), Israeli (1.9%, a difference of 0.23%), and Immigrants from Romania (1.9%, a difference of 0.29%).
| Demographics | Rating | Rank | No Schooling Completed |
| Cree | 94.5 /100 | #122 | Exceptional 1.9% |
| Immigrants | Kuwait | 93.9 /100 | #123 | Exceptional 1.9% |
| Cambodians | 93.8 /100 | #124 | Exceptional 1.9% |
| Immigrants | Europe | 93.7 /100 | #125 | Exceptional 1.9% |
| Immigrants | Romania | 92.6 /100 | #126 | Exceptional 1.9% |
| Israelis | 92.4 /100 | #127 | Exceptional 1.9% |
| Spaniards | 92.3 /100 | #128 | Exceptional 1.9% |
| Seminole | 92.0 /100 | #129 | Exceptional 1.9% |
| Palestinians | 91.8 /100 | #130 | Exceptional 1.9% |
| Immigrants | Hungary | 91.6 /100 | #131 | Exceptional 1.9% |
| Colville | 90.4 /100 | #132 | Exceptional 1.9% |
| Immigrants | Turkey | 90.2 /100 | #133 | Exceptional 1.9% |
| Menominee | 89.6 /100 | #134 | Excellent 1.9% |
| Hmong | 88.5 /100 | #135 | Excellent 1.9% |
| Burmese | 88.2 /100 | #136 | Excellent 1.9% |
Demographics Similar to Immigrants from Somalia by No Schooling Completed
In terms of no schooling completed, the demographic groups most similar to Immigrants from Somalia are Immigrants from Haiti (3.0%, a difference of 0.16%), Belizean (3.0%, a difference of 0.24%), Hispanic or Latino (3.0%, a difference of 0.81%), Guyanese (3.0%, a difference of 0.86%), and Immigrants from the Azores (3.0%, a difference of 0.96%).
| Demographics | Rating | Rank | No Schooling Completed |
| Immigrants | South Eastern Asia | 0.0 /100 | #301 | Tragic 2.9% |
| Immigrants | Caribbean | 0.0 /100 | #302 | Tragic 2.9% |
| Somalis | 0.0 /100 | #303 | Tragic 2.9% |
| Nicaraguans | 0.0 /100 | #304 | Tragic 2.9% |
| Ecuadorians | 0.0 /100 | #305 | Tragic 3.0% |
| Belizeans | 0.0 /100 | #306 | Tragic 3.0% |
| Immigrants | Haiti | 0.0 /100 | #307 | Tragic 3.0% |
| Immigrants | Somalia | 0.0 /100 | #308 | Tragic 3.0% |
| Hispanics or Latinos | 0.0 /100 | #309 | Tragic 3.0% |
| Guyanese | 0.0 /100 | #310 | Tragic 3.0% |
| Immigrants | Azores | 0.0 /100 | #311 | Tragic 3.0% |
| Sri Lankans | 0.0 /100 | #312 | Tragic 3.0% |
| Hondurans | 0.0 /100 | #313 | Tragic 3.1% |
| Immigrants | Belize | 0.0 /100 | #314 | Tragic 3.1% |
| Immigrants | Nicaragua | 0.0 /100 | #315 | Tragic 3.1% |