Seminole vs Alaskan Athabascan No Schooling Completed
COMPARE
Seminole
Alaskan Athabascan
No Schooling Completed
No Schooling Completed Comparison
Seminole
Alaskan Athabascans
1.9%
NO SCHOOLING COMPLETED
92.0/ 100
METRIC RATING
129th/ 347
METRIC RANK
1.5%
NO SCHOOLING COMPLETED
100.0/ 100
METRIC RATING
19th/ 347
METRIC RANK
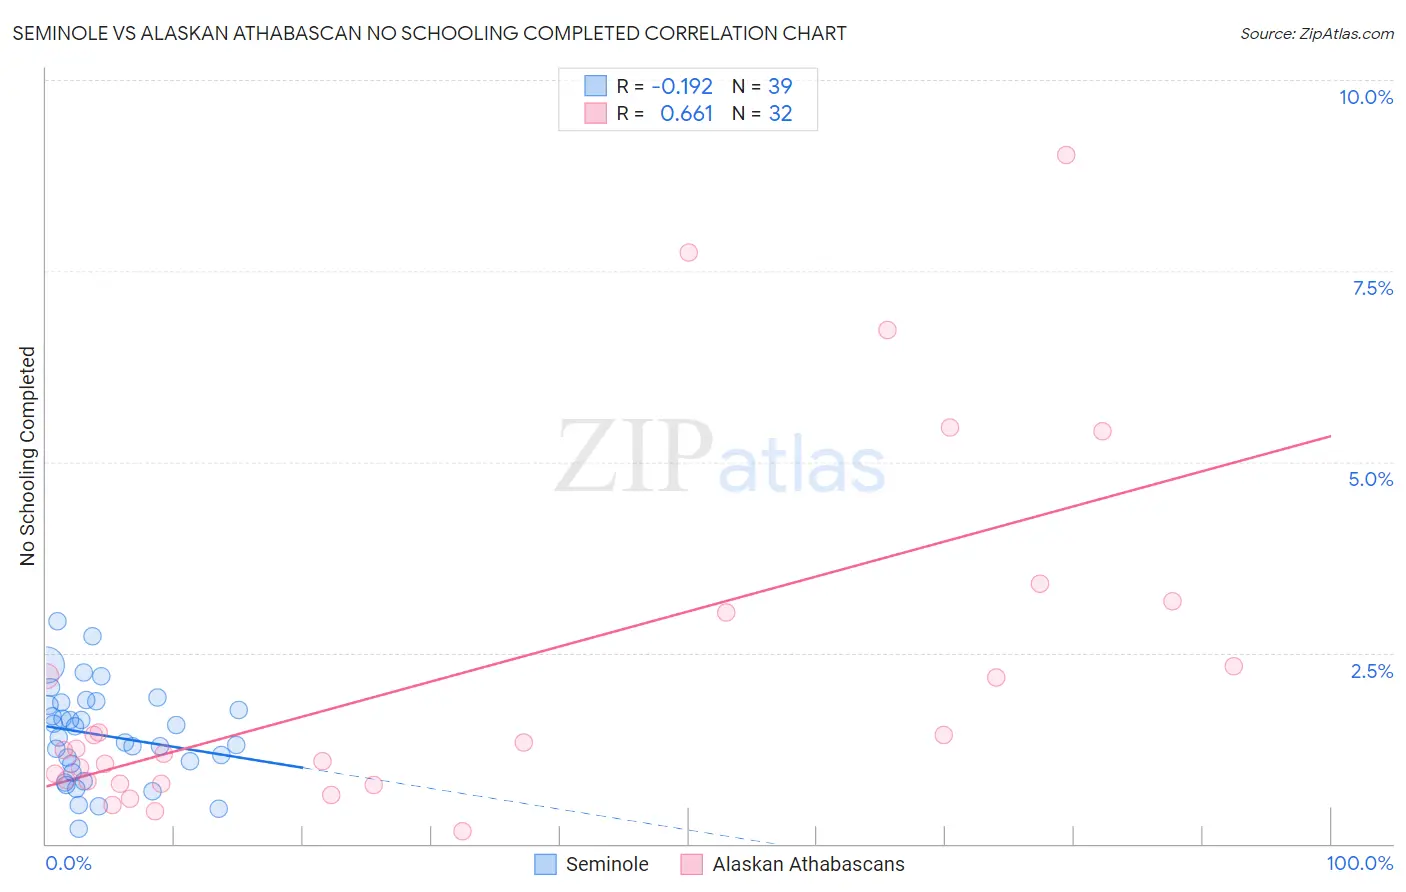
Seminole vs Alaskan Athabascan No Schooling Completed Correlation Chart
The statistical analysis conducted on geographies consisting of 117,813,139 people shows a poor negative correlation between the proportion of Seminole and percentage of population with no schooling in the United States with a correlation coefficient (R) of -0.192 and weighted average of 1.9%. Similarly, the statistical analysis conducted on geographies consisting of 45,557,234 people shows a significant positive correlation between the proportion of Alaskan Athabascans and percentage of population with no schooling in the United States with a correlation coefficient (R) of 0.661 and weighted average of 1.5%, a difference of 31.0%.
No Schooling Completed Correlation Summary
| Measurement | Seminole | Alaskan Athabascan |
| Minimum | 0.20% | 0.16% |
| Maximum | 2.9% | 9.0% |
| Range | 2.7% | 8.9% |
| Mean | 1.4% | 2.2% |
| Median | 1.4% | 1.2% |
| Interquartile 25% (IQ1) | 0.93% | 0.81% |
| Interquartile 75% (IQ3) | 1.9% | 2.7% |
| Interquartile Range (IQR) | 0.92% | 1.9% |
| Standard Deviation (Sample) | 0.62% | 2.3% |
| Standard Deviation (Population) | 0.62% | 2.2% |
Similar Demographics by No Schooling Completed
Demographics Similar to Seminole by No Schooling Completed
In terms of no schooling completed, the demographic groups most similar to Seminole are Palestinian (1.9%, a difference of 0.11%), Spaniard (1.9%, a difference of 0.14%), Immigrants from Hungary (1.9%, a difference of 0.21%), Israeli (1.9%, a difference of 0.23%), and Immigrants from Romania (1.9%, a difference of 0.29%).
| Demographics | Rating | Rank | No Schooling Completed |
| Cree | 94.5 /100 | #122 | Exceptional 1.9% |
| Immigrants | Kuwait | 93.9 /100 | #123 | Exceptional 1.9% |
| Cambodians | 93.8 /100 | #124 | Exceptional 1.9% |
| Immigrants | Europe | 93.7 /100 | #125 | Exceptional 1.9% |
| Immigrants | Romania | 92.6 /100 | #126 | Exceptional 1.9% |
| Israelis | 92.4 /100 | #127 | Exceptional 1.9% |
| Spaniards | 92.3 /100 | #128 | Exceptional 1.9% |
| Seminole | 92.0 /100 | #129 | Exceptional 1.9% |
| Palestinians | 91.8 /100 | #130 | Exceptional 1.9% |
| Immigrants | Hungary | 91.6 /100 | #131 | Exceptional 1.9% |
| Colville | 90.4 /100 | #132 | Exceptional 1.9% |
| Immigrants | Turkey | 90.2 /100 | #133 | Exceptional 1.9% |
| Menominee | 89.6 /100 | #134 | Excellent 1.9% |
| Hmong | 88.5 /100 | #135 | Excellent 1.9% |
| Burmese | 88.2 /100 | #136 | Excellent 1.9% |
Demographics Similar to Alaskan Athabascans by No Schooling Completed
In terms of no schooling completed, the demographic groups most similar to Alaskan Athabascans are Danish (1.5%, a difference of 0.10%), Welsh (1.5%, a difference of 0.13%), Croatian (1.5%, a difference of 0.41%), Finnish (1.5%, a difference of 0.42%), and Chinese (1.5%, a difference of 0.49%).
| Demographics | Rating | Rank | No Schooling Completed |
| Irish | 100.0 /100 | #12 | Exceptional 1.4% |
| Poles | 100.0 /100 | #13 | Exceptional 1.4% |
| Scotch-Irish | 100.0 /100 | #14 | Exceptional 1.5% |
| Tlingit-Haida | 100.0 /100 | #15 | Exceptional 1.5% |
| Finns | 100.0 /100 | #16 | Exceptional 1.5% |
| Croatians | 100.0 /100 | #17 | Exceptional 1.5% |
| Danes | 100.0 /100 | #18 | Exceptional 1.5% |
| Alaskan Athabascans | 100.0 /100 | #19 | Exceptional 1.5% |
| Welsh | 100.0 /100 | #20 | Exceptional 1.5% |
| Chinese | 100.0 /100 | #21 | Exceptional 1.5% |
| Alaska Natives | 100.0 /100 | #22 | Exceptional 1.5% |
| Europeans | 100.0 /100 | #23 | Exceptional 1.5% |
| Pennsylvania Germans | 100.0 /100 | #24 | Exceptional 1.5% |
| French | 100.0 /100 | #25 | Exceptional 1.5% |
| Czechs | 100.0 /100 | #26 | Exceptional 1.5% |