Seminole vs Bahamian No Schooling Completed
COMPARE
Seminole
Bahamian
No Schooling Completed
No Schooling Completed Comparison
Seminole
Bahamians
1.9%
NO SCHOOLING COMPLETED
92.0/ 100
METRIC RATING
129th/ 347
METRIC RANK
2.2%
NO SCHOOLING COMPLETED
11.6/ 100
METRIC RATING
206th/ 347
METRIC RANK
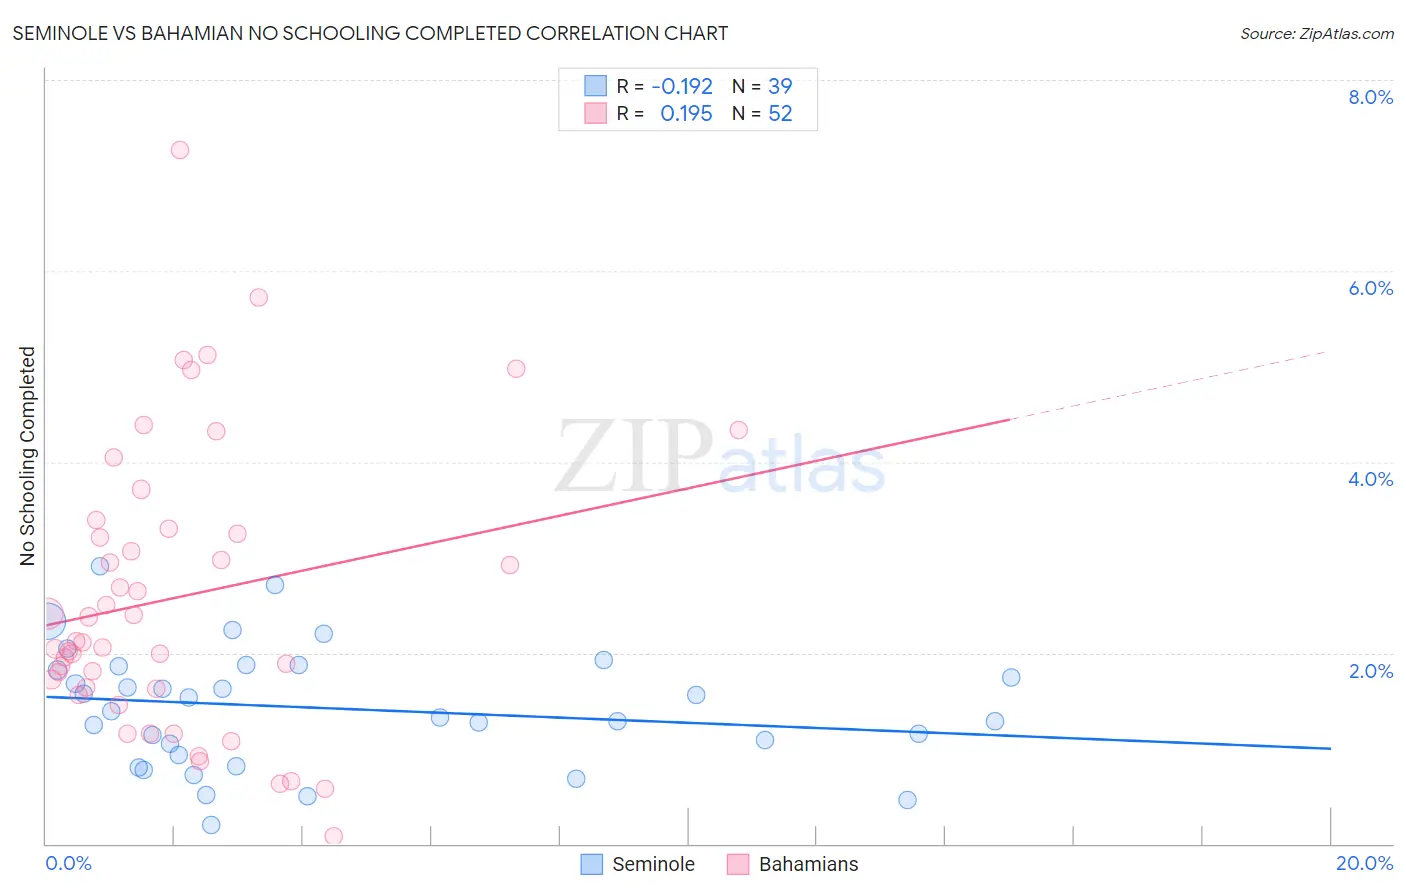
Seminole vs Bahamian No Schooling Completed Correlation Chart
The statistical analysis conducted on geographies consisting of 117,813,139 people shows a poor negative correlation between the proportion of Seminole and percentage of population with no schooling in the United States with a correlation coefficient (R) of -0.192 and weighted average of 1.9%. Similarly, the statistical analysis conducted on geographies consisting of 112,360,421 people shows a poor positive correlation between the proportion of Bahamians and percentage of population with no schooling in the United States with a correlation coefficient (R) of 0.195 and weighted average of 2.2%, a difference of 16.4%.
No Schooling Completed Correlation Summary
| Measurement | Seminole | Bahamian |
| Minimum | 0.20% | 0.079% |
| Maximum | 2.9% | 7.3% |
| Range | 2.7% | 7.2% |
| Mean | 1.4% | 2.6% |
| Median | 1.4% | 2.1% |
| Interquartile 25% (IQ1) | 0.93% | 1.6% |
| Interquartile 75% (IQ3) | 1.9% | 3.3% |
| Interquartile Range (IQR) | 0.92% | 1.6% |
| Standard Deviation (Sample) | 0.62% | 1.5% |
| Standard Deviation (Population) | 0.62% | 1.5% |
Similar Demographics by No Schooling Completed
Demographics Similar to Seminole by No Schooling Completed
In terms of no schooling completed, the demographic groups most similar to Seminole are Palestinian (1.9%, a difference of 0.11%), Spaniard (1.9%, a difference of 0.14%), Immigrants from Hungary (1.9%, a difference of 0.21%), Israeli (1.9%, a difference of 0.23%), and Immigrants from Romania (1.9%, a difference of 0.29%).
| Demographics | Rating | Rank | No Schooling Completed |
| Cree | 94.5 /100 | #122 | Exceptional 1.9% |
| Immigrants | Kuwait | 93.9 /100 | #123 | Exceptional 1.9% |
| Cambodians | 93.8 /100 | #124 | Exceptional 1.9% |
| Immigrants | Europe | 93.7 /100 | #125 | Exceptional 1.9% |
| Immigrants | Romania | 92.6 /100 | #126 | Exceptional 1.9% |
| Israelis | 92.4 /100 | #127 | Exceptional 1.9% |
| Spaniards | 92.3 /100 | #128 | Exceptional 1.9% |
| Seminole | 92.0 /100 | #129 | Exceptional 1.9% |
| Palestinians | 91.8 /100 | #130 | Exceptional 1.9% |
| Immigrants | Hungary | 91.6 /100 | #131 | Exceptional 1.9% |
| Colville | 90.4 /100 | #132 | Exceptional 1.9% |
| Immigrants | Turkey | 90.2 /100 | #133 | Exceptional 1.9% |
| Menominee | 89.6 /100 | #134 | Excellent 1.9% |
| Hmong | 88.5 /100 | #135 | Excellent 1.9% |
| Burmese | 88.2 /100 | #136 | Excellent 1.9% |
Demographics Similar to Bahamians by No Schooling Completed
In terms of no schooling completed, the demographic groups most similar to Bahamians are Immigrants from Bahamas (2.2%, a difference of 0.010%), South American Indian (2.2%, a difference of 0.18%), Uruguayan (2.2%, a difference of 0.19%), Hopi (2.2%, a difference of 0.41%), and Immigrants from Oceania (2.2%, a difference of 0.44%).
| Demographics | Rating | Rank | No Schooling Completed |
| Africans | 21.8 /100 | #199 | Fair 2.2% |
| Immigrants | Northern Africa | 19.5 /100 | #200 | Poor 2.2% |
| Costa Ricans | 17.1 /100 | #201 | Poor 2.2% |
| Moroccans | 13.7 /100 | #202 | Poor 2.2% |
| Laotians | 13.3 /100 | #203 | Poor 2.2% |
| Hopi | 12.9 /100 | #204 | Poor 2.2% |
| Immigrants | Bahamas | 11.6 /100 | #205 | Poor 2.2% |
| Bahamians | 11.6 /100 | #206 | Poor 2.2% |
| South American Indians | 11.0 /100 | #207 | Poor 2.2% |
| Uruguayans | 11.0 /100 | #208 | Poor 2.2% |
| Immigrants | Oceania | 10.2 /100 | #209 | Poor 2.2% |
| Natives/Alaskans | 10.0 /100 | #210 | Tragic 2.2% |
| Immigrants | Panama | 8.8 /100 | #211 | Tragic 2.3% |
| Immigrants | Morocco | 8.7 /100 | #212 | Tragic 2.3% |
| Ute | 8.2 /100 | #213 | Tragic 2.3% |