Seminole vs Immigrants from Somalia Unemployment Among Ages 30 to 34 years
COMPARE
Seminole
Immigrants from Somalia
Unemployment Among Ages 30 to 34 years
Unemployment Among Ages 30 to 34 years Comparison
Seminole
Immigrants from Somalia
6.2%
UNEMPLOYMENT AMONG AGES 30 TO 34 YEARS
0.0/ 100
METRIC RATING
266th/ 347
METRIC RANK
5.1%
UNEMPLOYMENT AMONG AGES 30 TO 34 YEARS
97.1/ 100
METRIC RATING
60th/ 347
METRIC RANK
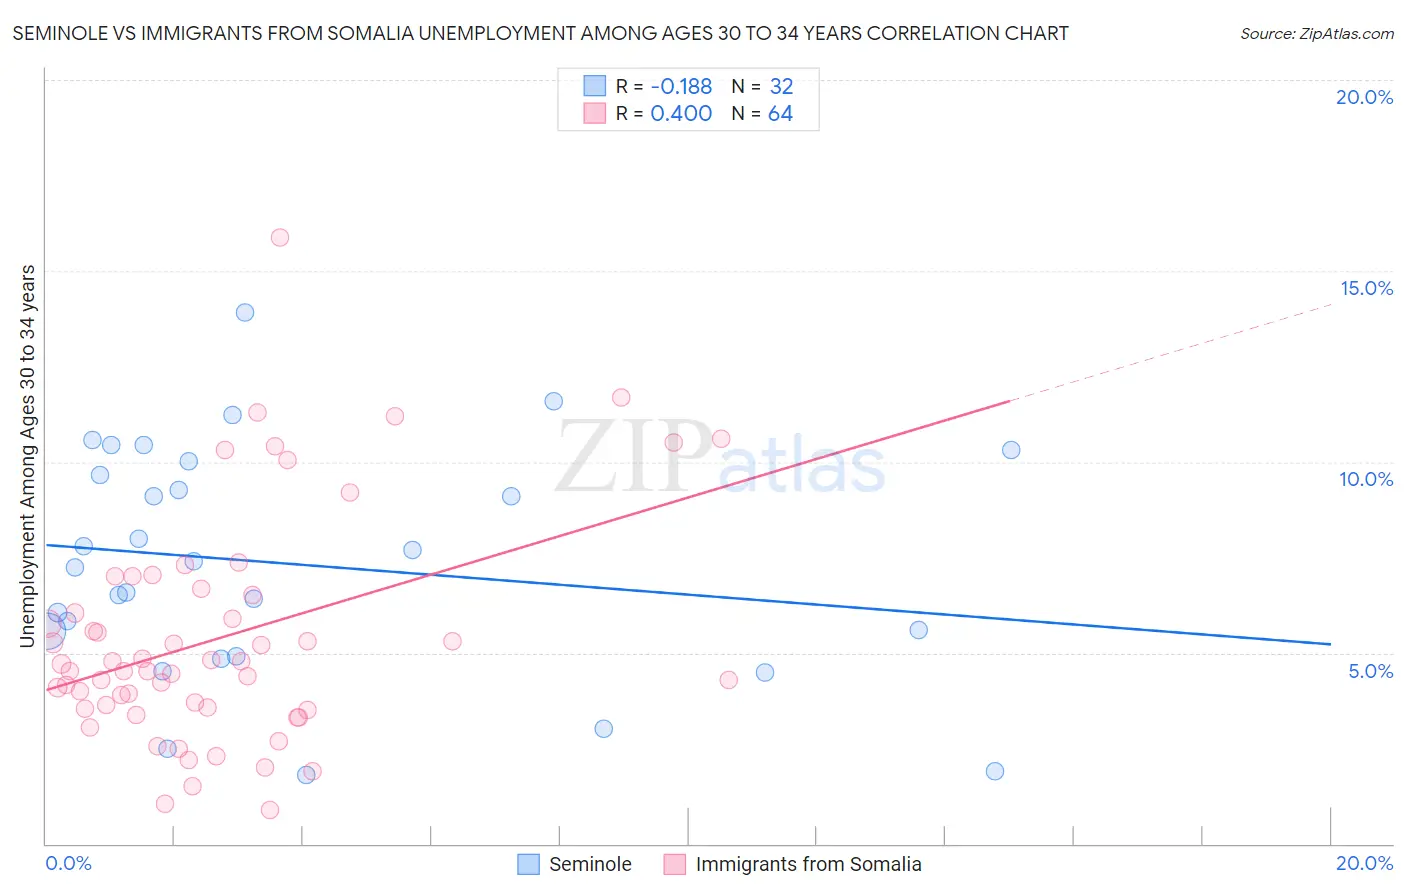
Seminole vs Immigrants from Somalia Unemployment Among Ages 30 to 34 years Correlation Chart
The statistical analysis conducted on geographies consisting of 115,777,899 people shows a poor negative correlation between the proportion of Seminole and unemployment rate among population between the ages 30 and 34 in the United States with a correlation coefficient (R) of -0.188 and weighted average of 6.2%. Similarly, the statistical analysis conducted on geographies consisting of 91,234,330 people shows a moderate positive correlation between the proportion of Immigrants from Somalia and unemployment rate among population between the ages 30 and 34 in the United States with a correlation coefficient (R) of 0.400 and weighted average of 5.1%, a difference of 21.1%.
Unemployment Among Ages 30 to 34 years Correlation Summary
| Measurement | Seminole | Immigrants from Somalia |
| Minimum | 1.8% | 0.90% |
| Maximum | 13.9% | 15.9% |
| Range | 12.1% | 15.0% |
| Mean | 7.3% | 5.4% |
| Median | 7.3% | 4.6% |
| Interquartile 25% (IQ1) | 5.2% | 3.5% |
| Interquartile 75% (IQ3) | 9.8% | 6.6% |
| Interquartile Range (IQR) | 4.6% | 3.0% |
| Standard Deviation (Sample) | 3.0% | 3.0% |
| Standard Deviation (Population) | 3.0% | 2.9% |
Similar Demographics by Unemployment Among Ages 30 to 34 years
Demographics Similar to Seminole by Unemployment Among Ages 30 to 34 years
In terms of unemployment among ages 30 to 34 years, the demographic groups most similar to Seminole are American (6.2%, a difference of 0.090%), Chickasaw (6.2%, a difference of 0.20%), Immigrants from Mexico (6.2%, a difference of 0.20%), Spanish American (6.2%, a difference of 0.25%), and Immigrants from Haiti (6.2%, a difference of 0.35%).
| Demographics | Rating | Rank | Unemployment Among Ages 30 to 34 years |
| Haitians | 0.1 /100 | #259 | Tragic 6.1% |
| Immigrants | Latin America | 0.1 /100 | #260 | Tragic 6.1% |
| Immigrants | Western Africa | 0.1 /100 | #261 | Tragic 6.2% |
| Immigrants | Central America | 0.1 /100 | #262 | Tragic 6.2% |
| Spanish Americans | 0.0 /100 | #263 | Tragic 6.2% |
| Chickasaw | 0.0 /100 | #264 | Tragic 6.2% |
| Americans | 0.0 /100 | #265 | Tragic 6.2% |
| Seminole | 0.0 /100 | #266 | Tragic 6.2% |
| Immigrants | Mexico | 0.0 /100 | #267 | Tragic 6.2% |
| Immigrants | Haiti | 0.0 /100 | #268 | Tragic 6.2% |
| French American Indians | 0.0 /100 | #269 | Tragic 6.3% |
| Immigrants | Senegal | 0.0 /100 | #270 | Tragic 6.3% |
| Comanche | 0.0 /100 | #271 | Tragic 6.3% |
| Blackfeet | 0.0 /100 | #272 | Tragic 6.3% |
| Ottawa | 0.0 /100 | #273 | Tragic 6.3% |
Demographics Similar to Immigrants from Somalia by Unemployment Among Ages 30 to 34 years
In terms of unemployment among ages 30 to 34 years, the demographic groups most similar to Immigrants from Somalia are Swedish (5.1%, a difference of 0.010%), Indian (Asian) (5.1%, a difference of 0.030%), Immigrants from France (5.1%, a difference of 0.050%), Belgian (5.1%, a difference of 0.060%), and Immigrants from Eastern Asia (5.1%, a difference of 0.080%).
| Demographics | Rating | Rank | Unemployment Among Ages 30 to 34 years |
| Cubans | 98.1 /100 | #53 | Exceptional 5.1% |
| Immigrants | Morocco | 97.9 /100 | #54 | Exceptional 5.1% |
| Chinese | 97.7 /100 | #55 | Exceptional 5.1% |
| Immigrants | Serbia | 97.4 /100 | #56 | Exceptional 5.1% |
| Immigrants | China | 97.2 /100 | #57 | Exceptional 5.1% |
| Asians | 97.2 /100 | #58 | Exceptional 5.1% |
| Swedes | 97.1 /100 | #59 | Exceptional 5.1% |
| Immigrants | Somalia | 97.1 /100 | #60 | Exceptional 5.1% |
| Indians (Asian) | 97.0 /100 | #61 | Exceptional 5.1% |
| Immigrants | France | 97.0 /100 | #62 | Exceptional 5.1% |
| Belgians | 97.0 /100 | #63 | Exceptional 5.1% |
| Immigrants | Eastern Asia | 96.9 /100 | #64 | Exceptional 5.1% |
| Immigrants | Japan | 96.8 /100 | #65 | Exceptional 5.1% |
| Immigrants | Zimbabwe | 96.7 /100 | #66 | Exceptional 5.1% |
| Burmese | 96.5 /100 | #67 | Exceptional 5.1% |