Chickasaw vs Immigrants from Somalia No Schooling Completed
COMPARE
Chickasaw
Immigrants from Somalia
No Schooling Completed
No Schooling Completed Comparison
Chickasaw
Immigrants from Somalia
1.7%
NO SCHOOLING COMPLETED
99.6/ 100
METRIC RATING
69th/ 347
METRIC RANK
3.0%
NO SCHOOLING COMPLETED
0.0/ 100
METRIC RATING
308th/ 347
METRIC RANK
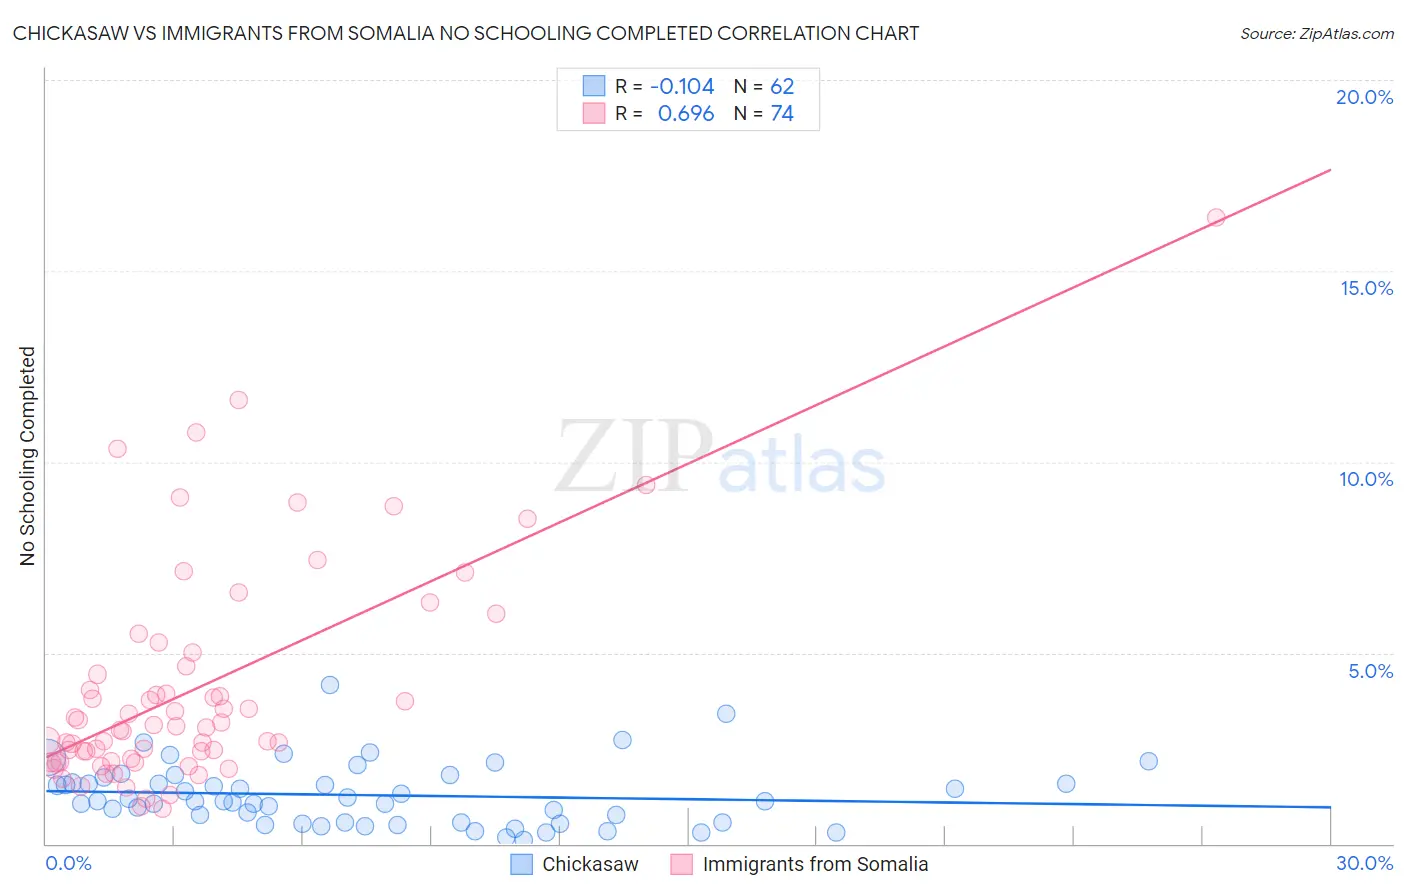
Chickasaw vs Immigrants from Somalia No Schooling Completed Correlation Chart
The statistical analysis conducted on geographies consisting of 146,942,262 people shows a poor negative correlation between the proportion of Chickasaw and percentage of population with no schooling in the United States with a correlation coefficient (R) of -0.104 and weighted average of 1.7%. Similarly, the statistical analysis conducted on geographies consisting of 92,035,757 people shows a significant positive correlation between the proportion of Immigrants from Somalia and percentage of population with no schooling in the United States with a correlation coefficient (R) of 0.696 and weighted average of 3.0%, a difference of 77.7%.
No Schooling Completed Correlation Summary
| Measurement | Chickasaw | Immigrants from Somalia |
| Minimum | 0.11% | 0.92% |
| Maximum | 4.2% | 16.4% |
| Range | 4.1% | 15.5% |
| Mean | 1.3% | 4.1% |
| Median | 1.1% | 3.0% |
| Interquartile 25% (IQ1) | 0.57% | 2.2% |
| Interquartile 75% (IQ3) | 1.6% | 4.6% |
| Interquartile Range (IQR) | 1.0% | 2.5% |
| Standard Deviation (Sample) | 0.81% | 2.9% |
| Standard Deviation (Population) | 0.80% | 2.9% |
Similar Demographics by No Schooling Completed
Demographics Similar to Chickasaw by No Schooling Completed
In terms of no schooling completed, the demographic groups most similar to Chickasaw are Immigrants from Lithuania (1.7%, a difference of 0.27%), Immigrants from Netherlands (1.7%, a difference of 0.97%), Immigrants from Austria (1.7%, a difference of 1.0%), Canadian (1.7%, a difference of 1.2%), and Immigrants from England (1.7%, a difference of 1.3%).
| Demographics | Rating | Rank | No Schooling Completed |
| Immigrants | Northern Europe | 99.8 /100 | #62 | Exceptional 1.7% |
| Russians | 99.8 /100 | #63 | Exceptional 1.7% |
| New Zealanders | 99.7 /100 | #64 | Exceptional 1.7% |
| Serbians | 99.7 /100 | #65 | Exceptional 1.7% |
| Canadians | 99.7 /100 | #66 | Exceptional 1.7% |
| Immigrants | Austria | 99.7 /100 | #67 | Exceptional 1.7% |
| Immigrants | Lithuania | 99.7 /100 | #68 | Exceptional 1.7% |
| Chickasaw | 99.6 /100 | #69 | Exceptional 1.7% |
| Immigrants | Netherlands | 99.6 /100 | #70 | Exceptional 1.7% |
| Immigrants | England | 99.5 /100 | #71 | Exceptional 1.7% |
| Cajuns | 99.5 /100 | #72 | Exceptional 1.7% |
| Immigrants | India | 99.4 /100 | #73 | Exceptional 1.7% |
| Zimbabweans | 99.4 /100 | #74 | Exceptional 1.7% |
| Immigrants | Belgium | 99.3 /100 | #75 | Exceptional 1.7% |
| Cherokee | 99.3 /100 | #76 | Exceptional 1.7% |
Demographics Similar to Immigrants from Somalia by No Schooling Completed
In terms of no schooling completed, the demographic groups most similar to Immigrants from Somalia are Immigrants from Haiti (3.0%, a difference of 0.16%), Belizean (3.0%, a difference of 0.24%), Hispanic or Latino (3.0%, a difference of 0.81%), Guyanese (3.0%, a difference of 0.86%), and Immigrants from the Azores (3.0%, a difference of 0.96%).
| Demographics | Rating | Rank | No Schooling Completed |
| Immigrants | South Eastern Asia | 0.0 /100 | #301 | Tragic 2.9% |
| Immigrants | Caribbean | 0.0 /100 | #302 | Tragic 2.9% |
| Somalis | 0.0 /100 | #303 | Tragic 2.9% |
| Nicaraguans | 0.0 /100 | #304 | Tragic 2.9% |
| Ecuadorians | 0.0 /100 | #305 | Tragic 3.0% |
| Belizeans | 0.0 /100 | #306 | Tragic 3.0% |
| Immigrants | Haiti | 0.0 /100 | #307 | Tragic 3.0% |
| Immigrants | Somalia | 0.0 /100 | #308 | Tragic 3.0% |
| Hispanics or Latinos | 0.0 /100 | #309 | Tragic 3.0% |
| Guyanese | 0.0 /100 | #310 | Tragic 3.0% |
| Immigrants | Azores | 0.0 /100 | #311 | Tragic 3.0% |
| Sri Lankans | 0.0 /100 | #312 | Tragic 3.0% |
| Hondurans | 0.0 /100 | #313 | Tragic 3.1% |
| Immigrants | Belize | 0.0 /100 | #314 | Tragic 3.1% |
| Immigrants | Nicaragua | 0.0 /100 | #315 | Tragic 3.1% |