Scottish vs Spaniard Associate's Degree
COMPARE
Scottish
Spaniard
Associate's Degree
Associate's Degree Comparison
Scottish
Spaniards
46.9%
ASSOCIATE'S DEGREE
65.4/ 100
METRIC RATING
160th/ 347
METRIC RANK
45.2%
ASSOCIATE'S DEGREE
20.4/ 100
METRIC RATING
202nd/ 347
METRIC RANK
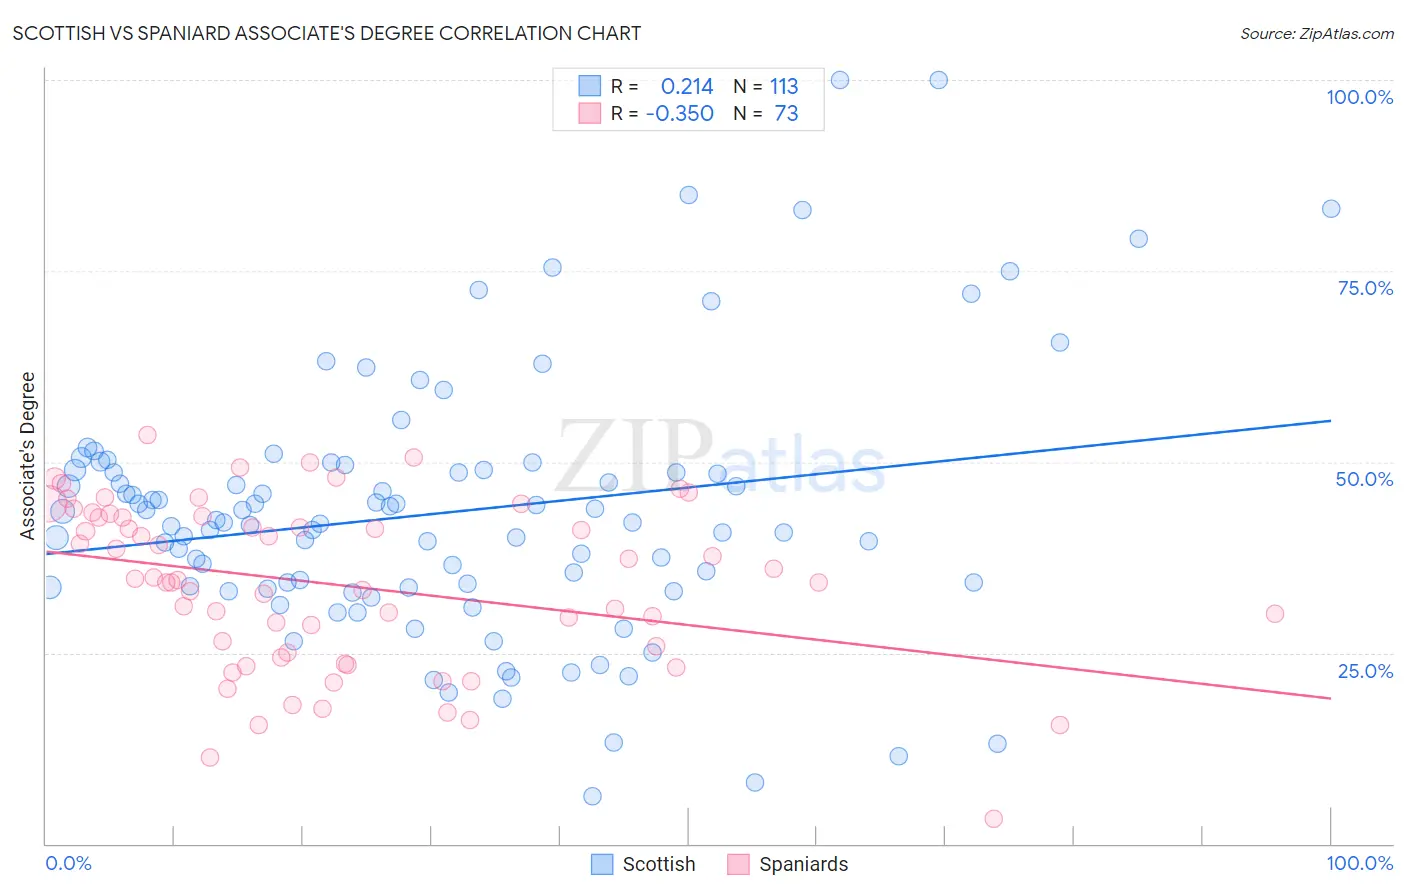
Scottish vs Spaniard Associate's Degree Correlation Chart
The statistical analysis conducted on geographies consisting of 567,065,260 people shows a weak positive correlation between the proportion of Scottish and percentage of population with at least associate's degree education in the United States with a correlation coefficient (R) of 0.214 and weighted average of 46.9%. Similarly, the statistical analysis conducted on geographies consisting of 443,508,579 people shows a mild negative correlation between the proportion of Spaniards and percentage of population with at least associate's degree education in the United States with a correlation coefficient (R) of -0.350 and weighted average of 45.2%, a difference of 3.8%.
Associate's Degree Correlation Summary
| Measurement | Scottish | Spaniard |
| Minimum | 6.2% | 3.3% |
| Maximum | 100.0% | 53.6% |
| Range | 93.7% | 50.2% |
| Mean | 43.3% | 33.8% |
| Median | 42.0% | 34.5% |
| Interquartile 25% (IQ1) | 33.6% | 24.7% |
| Interquartile 75% (IQ3) | 49.0% | 42.8% |
| Interquartile Range (IQR) | 15.4% | 18.1% |
| Standard Deviation (Sample) | 17.2% | 10.9% |
| Standard Deviation (Population) | 17.1% | 10.8% |
Similar Demographics by Associate's Degree
Demographics Similar to Scottish by Associate's Degree
In terms of associate's degree, the demographic groups most similar to Scottish are Scandinavian (46.9%, a difference of 0.020%), Immigrants from Africa (46.8%, a difference of 0.18%), Somali (46.8%, a difference of 0.23%), Colombian (46.8%, a difference of 0.24%), and Immigrants from Poland (47.1%, a difference of 0.31%).
| Demographics | Rating | Rank | Associate's Degree |
| Czechs | 72.2 /100 | #153 | Good 47.2% |
| Immigrants | Kenya | 72.1 /100 | #154 | Good 47.2% |
| Kenyans | 70.6 /100 | #155 | Good 47.1% |
| South Americans | 70.5 /100 | #156 | Good 47.1% |
| Sudanese | 70.3 /100 | #157 | Good 47.1% |
| Immigrants | Germany | 69.7 /100 | #158 | Good 47.1% |
| Immigrants | Poland | 69.2 /100 | #159 | Good 47.1% |
| Scottish | 65.4 /100 | #160 | Good 46.9% |
| Scandinavians | 65.2 /100 | #161 | Good 46.9% |
| Immigrants | Africa | 63.2 /100 | #162 | Good 46.8% |
| Somalis | 62.5 /100 | #163 | Good 46.8% |
| Colombians | 62.4 /100 | #164 | Good 46.8% |
| Immigrants | South America | 59.9 /100 | #165 | Average 46.7% |
| Hungarians | 59.3 /100 | #166 | Average 46.7% |
| Immigrants | Sierra Leone | 59.2 /100 | #167 | Average 46.7% |
Demographics Similar to Spaniards by Associate's Degree
In terms of associate's degree, the demographic groups most similar to Spaniards are Immigrants from South Eastern Asia (45.2%, a difference of 0.020%), Immigrants from Vietnam (45.2%, a difference of 0.050%), Senegalese (45.2%, a difference of 0.080%), Immigrants from Senegal (45.2%, a difference of 0.090%), and Immigrants from Bangladesh (45.2%, a difference of 0.11%).
| Demographics | Rating | Rank | Associate's Degree |
| Germans | 26.5 /100 | #195 | Fair 45.5% |
| French | 25.6 /100 | #196 | Fair 45.4% |
| Scotch-Irish | 22.3 /100 | #197 | Fair 45.3% |
| Immigrants | Bangladesh | 21.3 /100 | #198 | Fair 45.2% |
| Immigrants | Senegal | 21.2 /100 | #199 | Fair 45.2% |
| Senegalese | 21.1 /100 | #200 | Fair 45.2% |
| Immigrants | Vietnam | 20.8 /100 | #201 | Fair 45.2% |
| Spaniards | 20.4 /100 | #202 | Fair 45.2% |
| Immigrants | South Eastern Asia | 20.2 /100 | #203 | Fair 45.2% |
| Nigerians | 19.1 /100 | #204 | Poor 45.1% |
| Immigrants | Thailand | 18.9 /100 | #205 | Poor 45.1% |
| German Russians | 18.9 /100 | #206 | Poor 45.1% |
| Panamanians | 18.4 /100 | #207 | Poor 45.1% |
| Dutch | 17.6 /100 | #208 | Poor 45.0% |
| Immigrants | Costa Rica | 16.7 /100 | #209 | Poor 45.0% |