Scottish vs Yuman No Schooling Completed
COMPARE
Scottish
Yuman
No Schooling Completed
No Schooling Completed Comparison
Scottish
Yuman
1.4%
NO SCHOOLING COMPLETED
100.0/ 100
METRIC RATING
9th/ 347
METRIC RANK
2.5%
NO SCHOOLING COMPLETED
0.4/ 100
METRIC RATING
267th/ 347
METRIC RANK
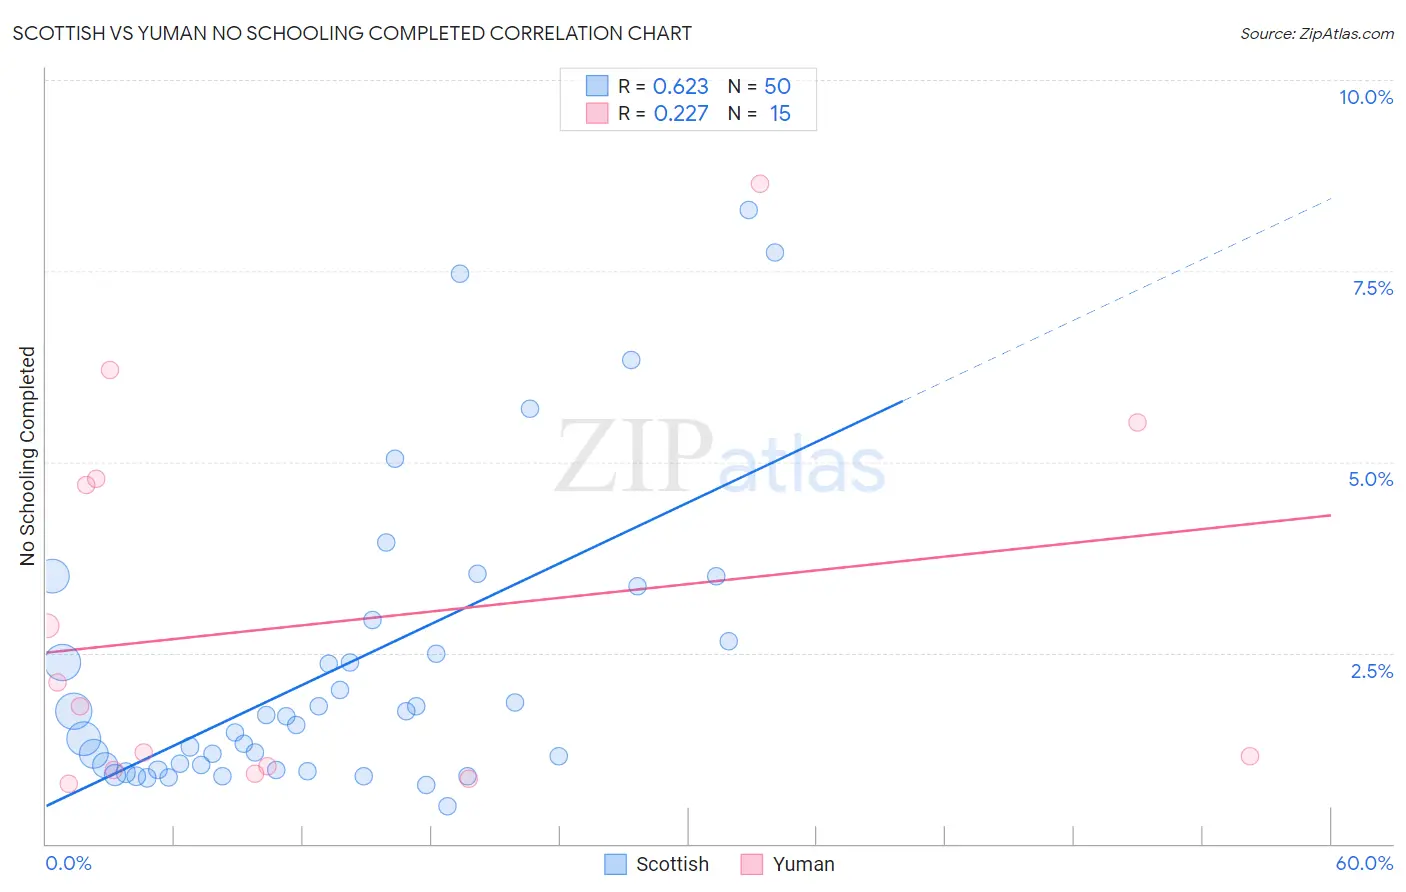
Scottish vs Yuman No Schooling Completed Correlation Chart
The statistical analysis conducted on geographies consisting of 548,415,962 people shows a significant positive correlation between the proportion of Scottish and percentage of population with no schooling in the United States with a correlation coefficient (R) of 0.623 and weighted average of 1.4%. Similarly, the statistical analysis conducted on geographies consisting of 40,618,798 people shows a weak positive correlation between the proportion of Yuman and percentage of population with no schooling in the United States with a correlation coefficient (R) of 0.227 and weighted average of 2.5%, a difference of 75.8%.
No Schooling Completed Correlation Summary
| Measurement | Scottish | Yuman |
| Minimum | 0.50% | 0.78% |
| Maximum | 8.3% | 8.6% |
| Range | 7.8% | 7.9% |
| Mean | 2.3% | 2.9% |
| Median | 1.6% | 1.8% |
| Interquartile 25% (IQ1) | 0.97% | 0.96% |
| Interquartile 75% (IQ3) | 2.7% | 4.8% |
| Interquartile Range (IQR) | 1.7% | 3.8% |
| Standard Deviation (Sample) | 1.9% | 2.5% |
| Standard Deviation (Population) | 1.9% | 2.4% |
Similar Demographics by No Schooling Completed
Demographics Similar to Scottish by No Schooling Completed
In terms of no schooling completed, the demographic groups most similar to Scottish are Swedish (1.4%, a difference of 0.53%), Dutch (1.4%, a difference of 0.80%), Lithuanian (1.4%, a difference of 1.6%), Irish (1.4%, a difference of 1.7%), and Polish (1.4%, a difference of 1.7%).
| Demographics | Rating | Rank | No Schooling Completed |
| Slovaks | 100.0 /100 | #2 | Exceptional 1.3% |
| Norwegians | 100.0 /100 | #3 | Exceptional 1.3% |
| Germans | 100.0 /100 | #4 | Exceptional 1.4% |
| Slovenes | 100.0 /100 | #5 | Exceptional 1.4% |
| Carpatho Rusyns | 100.0 /100 | #6 | Exceptional 1.4% |
| English | 100.0 /100 | #7 | Exceptional 1.4% |
| Swedes | 100.0 /100 | #8 | Exceptional 1.4% |
| Scottish | 100.0 /100 | #9 | Exceptional 1.4% |
| Dutch | 100.0 /100 | #10 | Exceptional 1.4% |
| Lithuanians | 100.0 /100 | #11 | Exceptional 1.4% |
| Irish | 100.0 /100 | #12 | Exceptional 1.4% |
| Poles | 100.0 /100 | #13 | Exceptional 1.4% |
| Scotch-Irish | 100.0 /100 | #14 | Exceptional 1.5% |
| Tlingit-Haida | 100.0 /100 | #15 | Exceptional 1.5% |
| Finns | 100.0 /100 | #16 | Exceptional 1.5% |
Demographics Similar to Yuman by No Schooling Completed
In terms of no schooling completed, the demographic groups most similar to Yuman are Fijian (2.5%, a difference of 0.17%), West Indian (2.5%, a difference of 0.25%), Taiwanese (2.5%, a difference of 0.26%), Indian (Asian) (2.5%, a difference of 0.43%), and Immigrants from Liberia (2.5%, a difference of 0.56%).
| Demographics | Rating | Rank | No Schooling Completed |
| Immigrants | Ethiopia | 0.6 /100 | #260 | Tragic 2.5% |
| Armenians | 0.5 /100 | #261 | Tragic 2.5% |
| Immigrants | Sierra Leone | 0.5 /100 | #262 | Tragic 2.5% |
| Immigrants | Liberia | 0.4 /100 | #263 | Tragic 2.5% |
| Indians (Asian) | 0.4 /100 | #264 | Tragic 2.5% |
| West Indians | 0.4 /100 | #265 | Tragic 2.5% |
| Fijians | 0.4 /100 | #266 | Tragic 2.5% |
| Yuman | 0.4 /100 | #267 | Tragic 2.5% |
| Taiwanese | 0.3 /100 | #268 | Tragic 2.5% |
| Immigrants | Nigeria | 0.2 /100 | #269 | Tragic 2.5% |
| Immigrants | Peru | 0.2 /100 | #270 | Tragic 2.5% |
| Cubans | 0.2 /100 | #271 | Tragic 2.5% |
| Immigrants | Bolivia | 0.2 /100 | #272 | Tragic 2.5% |
| Immigrants | Cameroon | 0.1 /100 | #273 | Tragic 2.5% |
| Ghanaians | 0.1 /100 | #274 | Tragic 2.6% |