Ukrainian vs Cuban Master's Degree
COMPARE
Ukrainian
Cuban
Master's Degree
Master's Degree Comparison
Ukrainians
Cubans
16.9%
MASTER'S DEGREE
98.3/ 100
METRIC RATING
104th/ 347
METRIC RANK
12.1%
MASTER'S DEGREE
0.3/ 100
METRIC RATING
275th/ 347
METRIC RANK
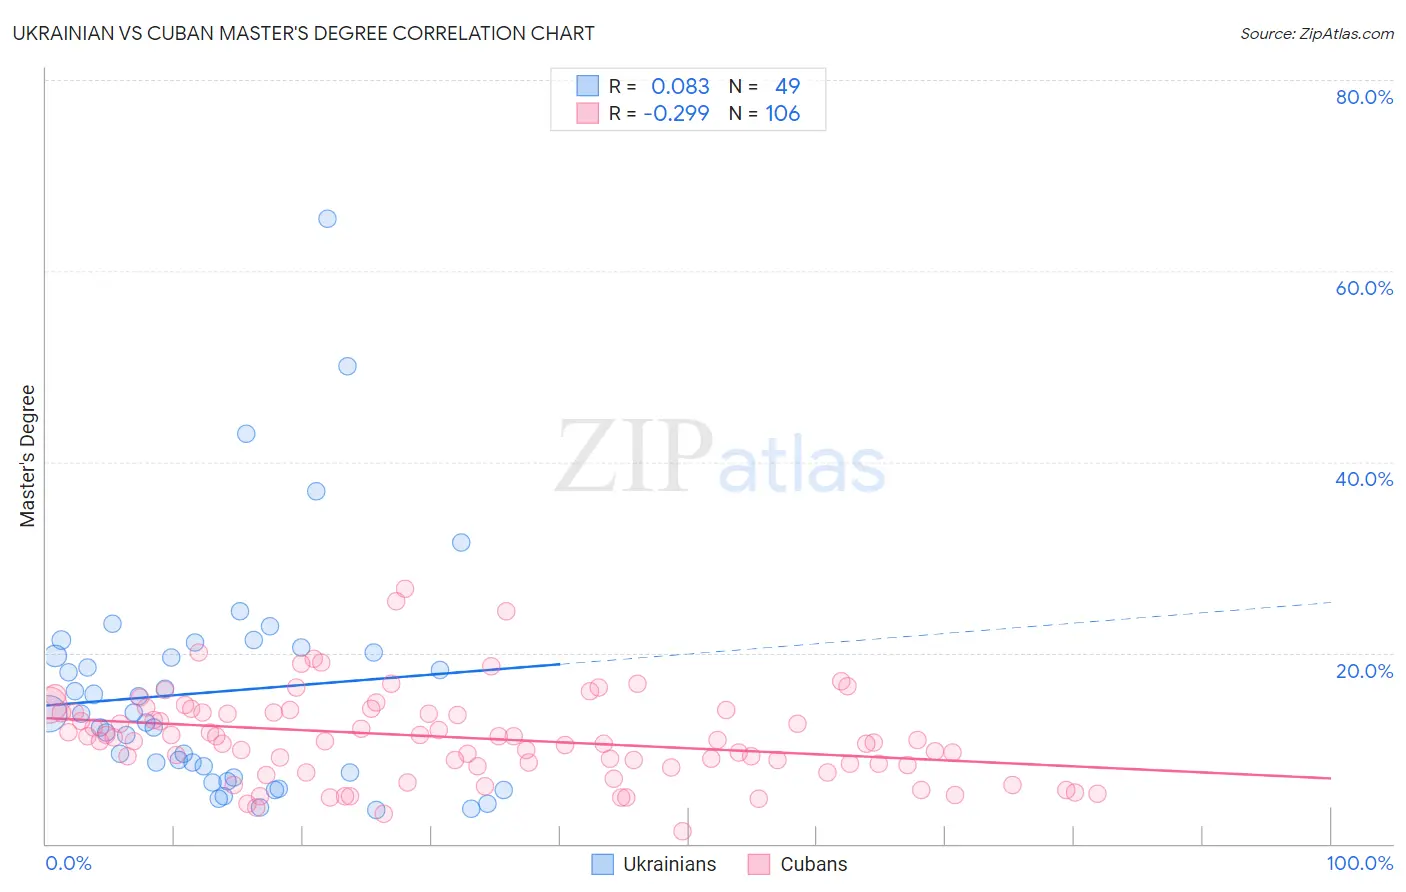
Ukrainian vs Cuban Master's Degree Correlation Chart
The statistical analysis conducted on geographies consisting of 448,518,691 people shows a slight positive correlation between the proportion of Ukrainians and percentage of population with at least master's degree education in the United States with a correlation coefficient (R) of 0.083 and weighted average of 16.9%. Similarly, the statistical analysis conducted on geographies consisting of 449,063,887 people shows a weak negative correlation between the proportion of Cubans and percentage of population with at least master's degree education in the United States with a correlation coefficient (R) of -0.299 and weighted average of 12.1%, a difference of 39.7%.
Master's Degree Correlation Summary
| Measurement | Ukrainian | Cuban |
| Minimum | 3.6% | 1.3% |
| Maximum | 65.5% | 26.7% |
| Range | 61.9% | 25.4% |
| Mean | 16.0% | 11.1% |
| Median | 13.6% | 10.8% |
| Interquartile 25% (IQ1) | 7.2% | 8.3% |
| Interquartile 75% (IQ3) | 20.3% | 13.8% |
| Interquartile Range (IQR) | 13.1% | 5.5% |
| Standard Deviation (Sample) | 12.3% | 4.7% |
| Standard Deviation (Population) | 12.2% | 4.7% |
Similar Demographics by Master's Degree
Demographics Similar to Ukrainians by Master's Degree
In terms of master's degree, the demographic groups most similar to Ukrainians are Syrian (16.8%, a difference of 0.10%), Alsatian (16.9%, a difference of 0.12%), Immigrants from Albania (16.8%, a difference of 0.38%), Chilean (16.9%, a difference of 0.45%), and Armenian (16.8%, a difference of 0.47%).
| Demographics | Rating | Rank | Master's Degree |
| Immigrants | England | 98.8 /100 | #97 | Exceptional 17.0% |
| Immigrants | Ukraine | 98.8 /100 | #98 | Exceptional 17.0% |
| Laotians | 98.8 /100 | #99 | Exceptional 17.0% |
| Albanians | 98.7 /100 | #100 | Exceptional 17.0% |
| Immigrants | Nepal | 98.6 /100 | #101 | Exceptional 17.0% |
| Chileans | 98.6 /100 | #102 | Exceptional 16.9% |
| Alsatians | 98.4 /100 | #103 | Exceptional 16.9% |
| Ukrainians | 98.3 /100 | #104 | Exceptional 16.9% |
| Syrians | 98.3 /100 | #105 | Exceptional 16.8% |
| Immigrants | Albania | 98.1 /100 | #106 | Exceptional 16.8% |
| Armenians | 98.0 /100 | #107 | Exceptional 16.8% |
| Sierra Leoneans | 98.0 /100 | #108 | Exceptional 16.8% |
| Moroccans | 98.0 /100 | #109 | Exceptional 16.8% |
| Immigrants | Chile | 98.0 /100 | #110 | Exceptional 16.8% |
| Austrians | 97.8 /100 | #111 | Exceptional 16.7% |
Demographics Similar to Cubans by Master's Degree
In terms of master's degree, the demographic groups most similar to Cubans are Cape Verdean (12.1%, a difference of 0.020%), Black/African American (12.1%, a difference of 0.050%), Immigrants from Caribbean (12.1%, a difference of 0.060%), Potawatomi (12.1%, a difference of 0.070%), and Blackfeet (12.1%, a difference of 0.10%).
| Demographics | Rating | Rank | Master's Degree |
| Native Hawaiians | 0.4 /100 | #268 | Tragic 12.3% |
| Central Americans | 0.3 /100 | #269 | Tragic 12.2% |
| Salvadorans | 0.3 /100 | #270 | Tragic 12.2% |
| Haitians | 0.3 /100 | #271 | Tragic 12.1% |
| Comanche | 0.3 /100 | #272 | Tragic 12.1% |
| Blackfeet | 0.3 /100 | #273 | Tragic 12.1% |
| Cape Verdeans | 0.3 /100 | #274 | Tragic 12.1% |
| Cubans | 0.3 /100 | #275 | Tragic 12.1% |
| Blacks/African Americans | 0.3 /100 | #276 | Tragic 12.1% |
| Immigrants | Caribbean | 0.3 /100 | #277 | Tragic 12.1% |
| Potawatomi | 0.3 /100 | #278 | Tragic 12.1% |
| Immigrants | Belize | 0.2 /100 | #279 | Tragic 12.1% |
| Immigrants | Dominican Republic | 0.2 /100 | #280 | Tragic 12.1% |
| Malaysians | 0.2 /100 | #281 | Tragic 12.0% |
| Immigrants | El Salvador | 0.2 /100 | #282 | Tragic 12.0% |