Scotch-Irish vs Swedish 12th Grade, No Diploma
COMPARE
Scotch-Irish
Swedish
12th Grade, No Diploma
12th Grade, No Diploma Comparison
Scotch-Irish
Swedes
92.4%
12TH GRADE, NO DIPLOMA
98.8/ 100
METRIC RATING
88th/ 347
METRIC RANK
93.7%
12TH GRADE, NO DIPLOMA
100.0/ 100
METRIC RATING
2nd/ 347
METRIC RANK
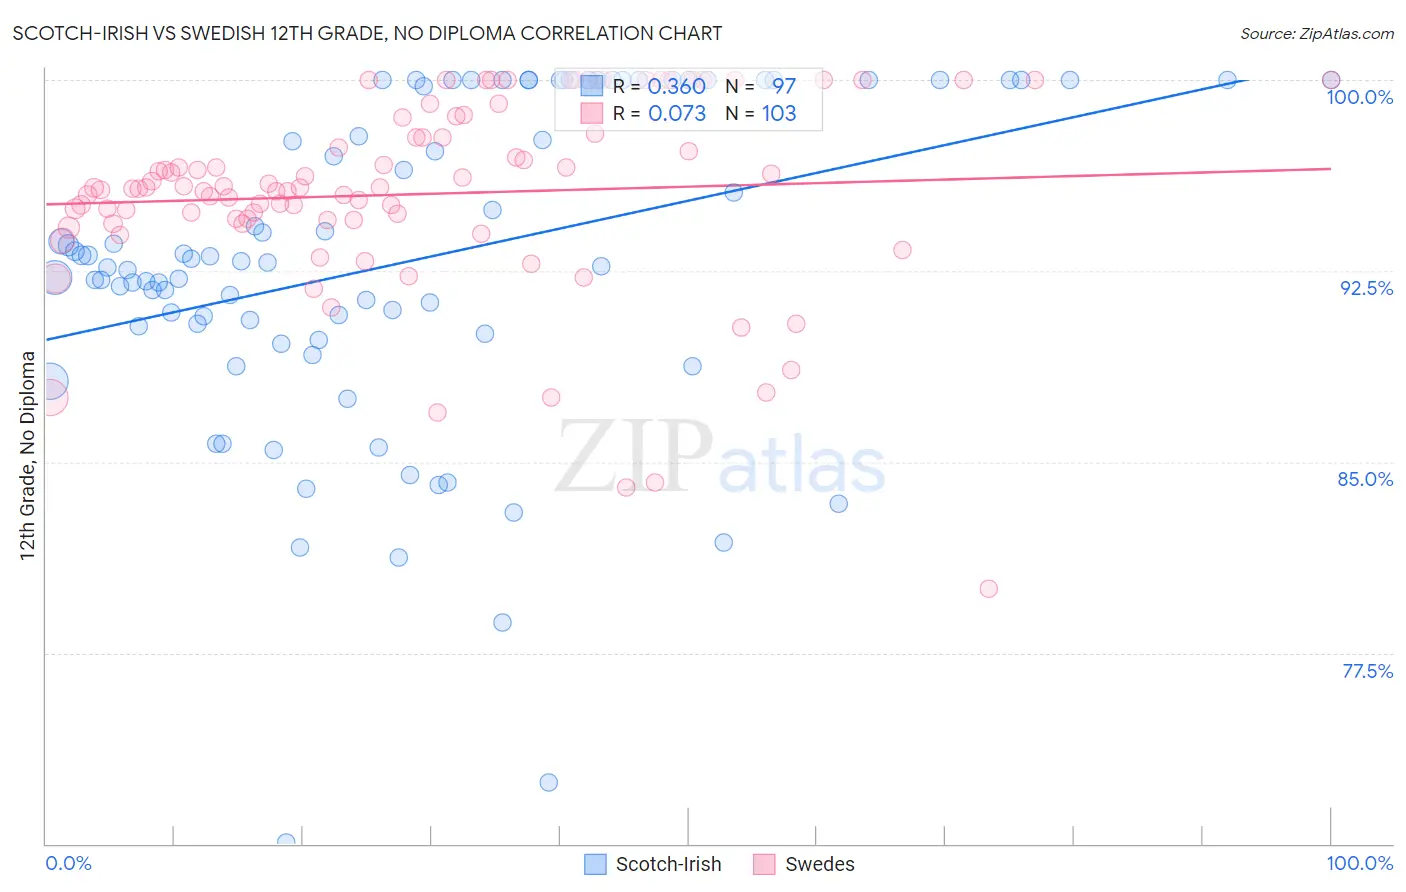
Scotch-Irish vs Swedish 12th Grade, No Diploma Correlation Chart
The statistical analysis conducted on geographies consisting of 548,779,904 people shows a mild positive correlation between the proportion of Scotch-Irish and percentage of population with at least 12th grade (no diploma) education in the United States with a correlation coefficient (R) of 0.360 and weighted average of 92.4%. Similarly, the statistical analysis conducted on geographies consisting of 539,231,694 people shows a slight positive correlation between the proportion of Swedes and percentage of population with at least 12th grade (no diploma) education in the United States with a correlation coefficient (R) of 0.073 and weighted average of 93.7%, a difference of 1.5%.
12th Grade, No Diploma Correlation Summary
| Measurement | Scotch-Irish | Swedish |
| Minimum | 70.0% | 80.0% |
| Maximum | 100.0% | 100.0% |
| Range | 30.0% | 20.0% |
| Mean | 92.9% | 95.5% |
| Median | 92.9% | 95.8% |
| Interquartile 25% (IQ1) | 90.2% | 94.5% |
| Interquartile 75% (IQ3) | 100.0% | 97.9% |
| Interquartile Range (IQR) | 9.8% | 3.4% |
| Standard Deviation (Sample) | 6.4% | 3.8% |
| Standard Deviation (Population) | 6.4% | 3.8% |
Similar Demographics by 12th Grade, No Diploma
Demographics Similar to Scotch-Irish by 12th Grade, No Diploma
In terms of 12th grade, no diploma, the demographic groups most similar to Scotch-Irish are Immigrants from France (92.4%, a difference of 0.010%), Immigrants from Turkey (92.4%, a difference of 0.030%), Canadian (92.4%, a difference of 0.030%), Immigrants from Serbia (92.4%, a difference of 0.040%), and South African (92.4%, a difference of 0.040%).
| Demographics | Rating | Rank | 12th Grade, No Diploma |
| Immigrants | Denmark | 99.2 /100 | #81 | Exceptional 92.5% |
| Immigrants | Switzerland | 99.2 /100 | #82 | Exceptional 92.5% |
| Immigrants | Israel | 99.2 /100 | #83 | Exceptional 92.5% |
| Immigrants | Bulgaria | 99.1 /100 | #84 | Exceptional 92.5% |
| Immigrants | Saudi Arabia | 99.0 /100 | #85 | Exceptional 92.5% |
| Immigrants | Turkey | 98.9 /100 | #86 | Exceptional 92.4% |
| Immigrants | France | 98.8 /100 | #87 | Exceptional 92.4% |
| Scotch-Irish | 98.8 /100 | #88 | Exceptional 92.4% |
| Canadians | 98.7 /100 | #89 | Exceptional 92.4% |
| Immigrants | Serbia | 98.6 /100 | #90 | Exceptional 92.4% |
| South Africans | 98.6 /100 | #91 | Exceptional 92.4% |
| Immigrants | Romania | 98.5 /100 | #92 | Exceptional 92.3% |
| Immigrants | Western Europe | 98.5 /100 | #93 | Exceptional 92.3% |
| Immigrants | Europe | 98.5 /100 | #94 | Exceptional 92.3% |
| Immigrants | North Macedonia | 98.5 /100 | #95 | Exceptional 92.3% |
Demographics Similar to Swedes by 12th Grade, No Diploma
In terms of 12th grade, no diploma, the demographic groups most similar to Swedes are Lithuanian (93.6%, a difference of 0.10%), Slovene (93.6%, a difference of 0.11%), Carpatho Rusyn (93.6%, a difference of 0.12%), Immigrants from India (93.6%, a difference of 0.13%), and Slovak (93.6%, a difference of 0.17%).
| Demographics | Rating | Rank | 12th Grade, No Diploma |
| Norwegians | 100.0 /100 | #1 | Exceptional 94.0% |
| Swedes | 100.0 /100 | #2 | Exceptional 93.7% |
| Lithuanians | 100.0 /100 | #3 | Exceptional 93.6% |
| Slovenes | 100.0 /100 | #4 | Exceptional 93.6% |
| Carpatho Rusyns | 100.0 /100 | #5 | Exceptional 93.6% |
| Immigrants | India | 100.0 /100 | #6 | Exceptional 93.6% |
| Slovaks | 100.0 /100 | #7 | Exceptional 93.6% |
| Chinese | 100.0 /100 | #8 | Exceptional 93.6% |
| Latvians | 100.0 /100 | #9 | Exceptional 93.6% |
| Croatians | 100.0 /100 | #10 | Exceptional 93.5% |
| Poles | 100.0 /100 | #11 | Exceptional 93.5% |
| Eastern Europeans | 100.0 /100 | #12 | Exceptional 93.5% |
| Danes | 100.0 /100 | #13 | Exceptional 93.5% |
| Bulgarians | 100.0 /100 | #14 | Exceptional 93.5% |
| Finns | 100.0 /100 | #15 | Exceptional 93.4% |