Scotch-Irish vs Peruvian 12th Grade, No Diploma
COMPARE
Scotch-Irish
Peruvian
12th Grade, No Diploma
12th Grade, No Diploma Comparison
Scotch-Irish
Peruvians
92.4%
12TH GRADE, NO DIPLOMA
98.8/ 100
METRIC RATING
88th/ 347
METRIC RANK
90.2%
12TH GRADE, NO DIPLOMA
2.7/ 100
METRIC RATING
231st/ 347
METRIC RANK
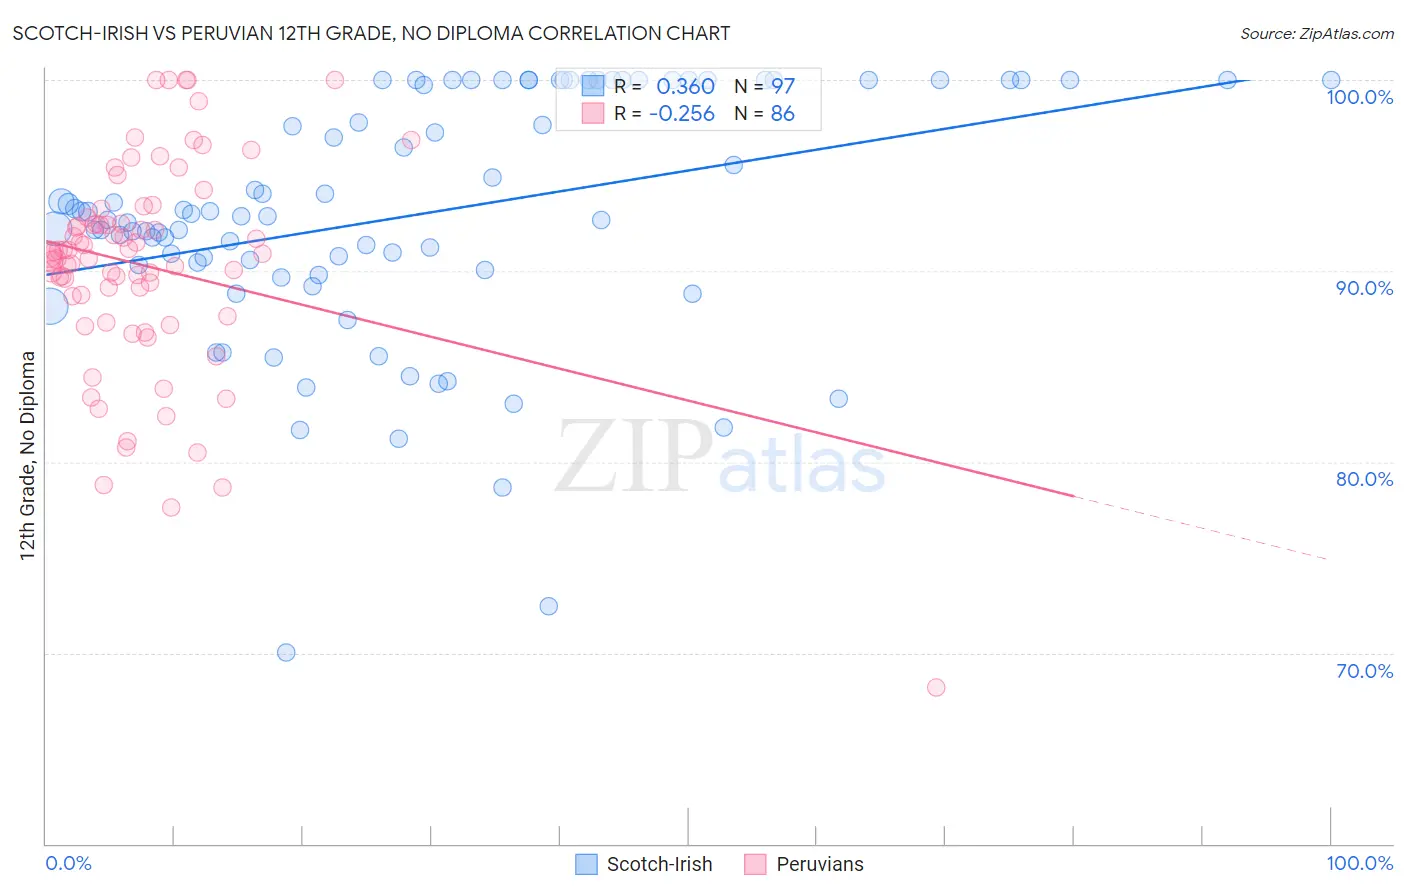
Scotch-Irish vs Peruvian 12th Grade, No Diploma Correlation Chart
The statistical analysis conducted on geographies consisting of 548,779,904 people shows a mild positive correlation between the proportion of Scotch-Irish and percentage of population with at least 12th grade (no diploma) education in the United States with a correlation coefficient (R) of 0.360 and weighted average of 92.4%. Similarly, the statistical analysis conducted on geographies consisting of 363,251,075 people shows a weak negative correlation between the proportion of Peruvians and percentage of population with at least 12th grade (no diploma) education in the United States with a correlation coefficient (R) of -0.256 and weighted average of 90.2%, a difference of 2.5%.
12th Grade, No Diploma Correlation Summary
| Measurement | Scotch-Irish | Peruvian |
| Minimum | 70.0% | 68.2% |
| Maximum | 100.0% | 100.0% |
| Range | 30.0% | 31.8% |
| Mean | 92.9% | 90.3% |
| Median | 92.9% | 90.9% |
| Interquartile 25% (IQ1) | 90.2% | 88.7% |
| Interquartile 75% (IQ3) | 100.0% | 92.5% |
| Interquartile Range (IQR) | 9.8% | 3.8% |
| Standard Deviation (Sample) | 6.4% | 5.5% |
| Standard Deviation (Population) | 6.4% | 5.5% |
Similar Demographics by 12th Grade, No Diploma
Demographics Similar to Scotch-Irish by 12th Grade, No Diploma
In terms of 12th grade, no diploma, the demographic groups most similar to Scotch-Irish are Immigrants from France (92.4%, a difference of 0.010%), Immigrants from Turkey (92.4%, a difference of 0.030%), Canadian (92.4%, a difference of 0.030%), Immigrants from Serbia (92.4%, a difference of 0.040%), and South African (92.4%, a difference of 0.040%).
| Demographics | Rating | Rank | 12th Grade, No Diploma |
| Immigrants | Denmark | 99.2 /100 | #81 | Exceptional 92.5% |
| Immigrants | Switzerland | 99.2 /100 | #82 | Exceptional 92.5% |
| Immigrants | Israel | 99.2 /100 | #83 | Exceptional 92.5% |
| Immigrants | Bulgaria | 99.1 /100 | #84 | Exceptional 92.5% |
| Immigrants | Saudi Arabia | 99.0 /100 | #85 | Exceptional 92.5% |
| Immigrants | Turkey | 98.9 /100 | #86 | Exceptional 92.4% |
| Immigrants | France | 98.8 /100 | #87 | Exceptional 92.4% |
| Scotch-Irish | 98.8 /100 | #88 | Exceptional 92.4% |
| Canadians | 98.7 /100 | #89 | Exceptional 92.4% |
| Immigrants | Serbia | 98.6 /100 | #90 | Exceptional 92.4% |
| South Africans | 98.6 /100 | #91 | Exceptional 92.4% |
| Immigrants | Romania | 98.5 /100 | #92 | Exceptional 92.3% |
| Immigrants | Western Europe | 98.5 /100 | #93 | Exceptional 92.3% |
| Immigrants | Europe | 98.5 /100 | #94 | Exceptional 92.3% |
| Immigrants | North Macedonia | 98.5 /100 | #95 | Exceptional 92.3% |
Demographics Similar to Peruvians by 12th Grade, No Diploma
In terms of 12th grade, no diploma, the demographic groups most similar to Peruvians are Immigrants from Philippines (90.2%, a difference of 0.010%), Blackfeet (90.1%, a difference of 0.030%), Immigrants from Thailand (90.1%, a difference of 0.050%), Immigrants from South America (90.1%, a difference of 0.050%), and Colville (90.1%, a difference of 0.050%).
| Demographics | Rating | Rank | 12th Grade, No Diploma |
| Immigrants | Panama | 4.8 /100 | #224 | Tragic 90.3% |
| Chickasaw | 4.8 /100 | #225 | Tragic 90.3% |
| Immigrants | Zaire | 4.6 /100 | #226 | Tragic 90.3% |
| Nigerians | 4.5 /100 | #227 | Tragic 90.3% |
| Creek | 3.9 /100 | #228 | Tragic 90.3% |
| Immigrants | Bahamas | 3.6 /100 | #229 | Tragic 90.2% |
| Immigrants | Philippines | 2.8 /100 | #230 | Tragic 90.2% |
| Peruvians | 2.7 /100 | #231 | Tragic 90.2% |
| Blackfeet | 2.4 /100 | #232 | Tragic 90.1% |
| Immigrants | Thailand | 2.3 /100 | #233 | Tragic 90.1% |
| Immigrants | South America | 2.3 /100 | #234 | Tragic 90.1% |
| Colville | 2.3 /100 | #235 | Tragic 90.1% |
| Immigrants | Uzbekistan | 2.2 /100 | #236 | Tragic 90.1% |
| Immigrants | Colombia | 2.1 /100 | #237 | Tragic 90.1% |
| Inupiat | 2.0 /100 | #238 | Tragic 90.1% |