Scotch-Irish vs Immigrants from Ireland 12th Grade, No Diploma
COMPARE
Scotch-Irish
Immigrants from Ireland
12th Grade, No Diploma
12th Grade, No Diploma Comparison
Scotch-Irish
Immigrants from Ireland
92.4%
12TH GRADE, NO DIPLOMA
98.8/ 100
METRIC RATING
88th/ 347
METRIC RANK
93.1%
12TH GRADE, NO DIPLOMA
99.9/ 100
METRIC RATING
31st/ 347
METRIC RANK
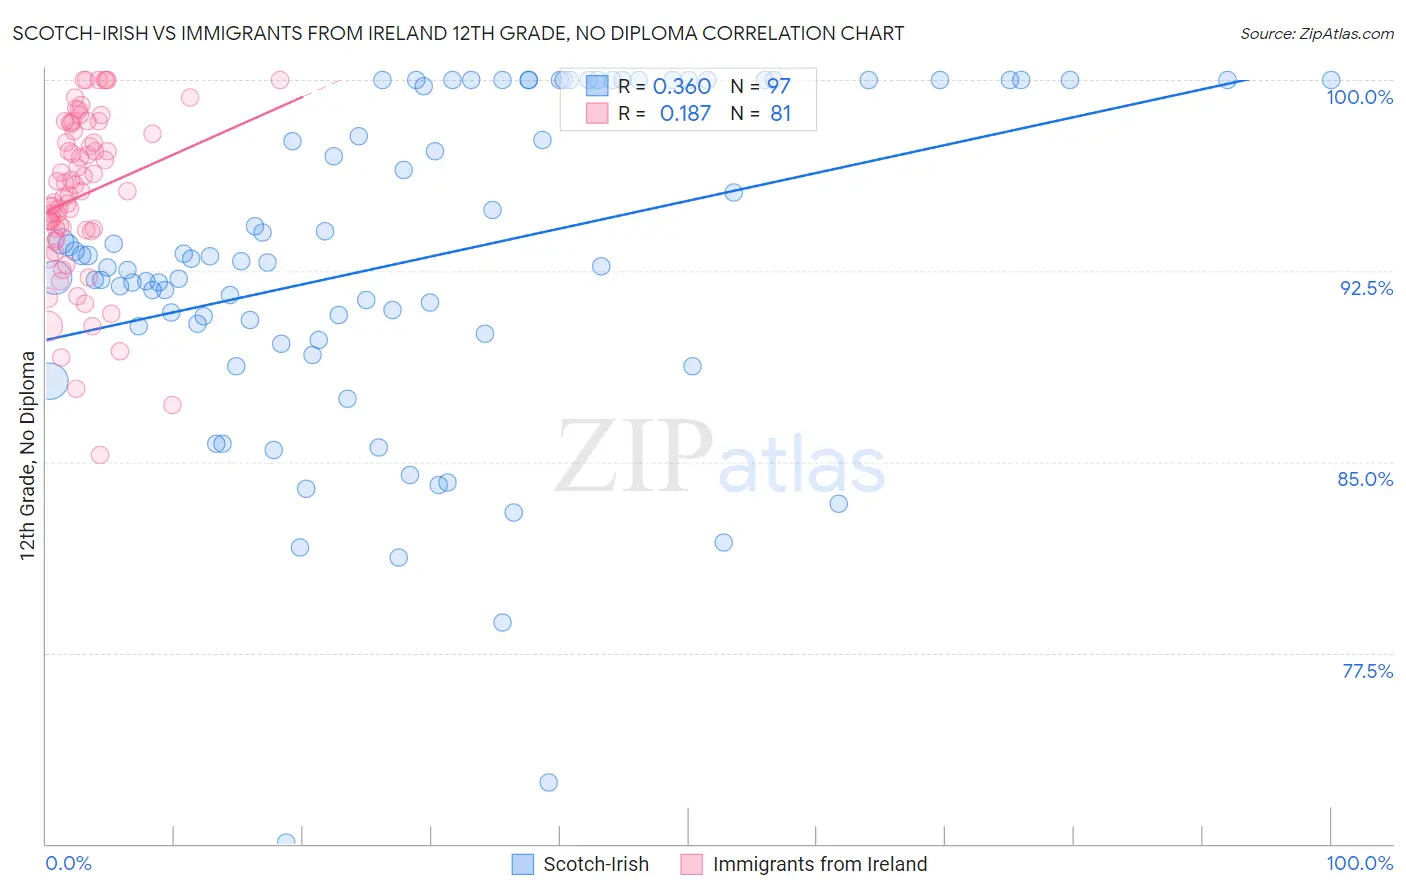
Scotch-Irish vs Immigrants from Ireland 12th Grade, No Diploma Correlation Chart
The statistical analysis conducted on geographies consisting of 548,779,904 people shows a mild positive correlation between the proportion of Scotch-Irish and percentage of population with at least 12th grade (no diploma) education in the United States with a correlation coefficient (R) of 0.360 and weighted average of 92.4%. Similarly, the statistical analysis conducted on geographies consisting of 240,784,498 people shows a poor positive correlation between the proportion of Immigrants from Ireland and percentage of population with at least 12th grade (no diploma) education in the United States with a correlation coefficient (R) of 0.187 and weighted average of 93.1%, a difference of 0.73%.
12th Grade, No Diploma Correlation Summary
| Measurement | Scotch-Irish | Immigrants from Ireland |
| Minimum | 70.0% | 85.3% |
| Maximum | 100.0% | 100.0% |
| Range | 30.0% | 14.7% |
| Mean | 92.9% | 95.5% |
| Median | 92.9% | 95.7% |
| Interquartile 25% (IQ1) | 90.2% | 94.1% |
| Interquartile 75% (IQ3) | 100.0% | 98.1% |
| Interquartile Range (IQR) | 9.8% | 4.0% |
| Standard Deviation (Sample) | 6.4% | 3.2% |
| Standard Deviation (Population) | 6.4% | 3.2% |
Similar Demographics by 12th Grade, No Diploma
Demographics Similar to Scotch-Irish by 12th Grade, No Diploma
In terms of 12th grade, no diploma, the demographic groups most similar to Scotch-Irish are Immigrants from France (92.4%, a difference of 0.010%), Immigrants from Turkey (92.4%, a difference of 0.030%), Canadian (92.4%, a difference of 0.030%), Immigrants from Serbia (92.4%, a difference of 0.040%), and South African (92.4%, a difference of 0.040%).
| Demographics | Rating | Rank | 12th Grade, No Diploma |
| Immigrants | Denmark | 99.2 /100 | #81 | Exceptional 92.5% |
| Immigrants | Switzerland | 99.2 /100 | #82 | Exceptional 92.5% |
| Immigrants | Israel | 99.2 /100 | #83 | Exceptional 92.5% |
| Immigrants | Bulgaria | 99.1 /100 | #84 | Exceptional 92.5% |
| Immigrants | Saudi Arabia | 99.0 /100 | #85 | Exceptional 92.5% |
| Immigrants | Turkey | 98.9 /100 | #86 | Exceptional 92.4% |
| Immigrants | France | 98.8 /100 | #87 | Exceptional 92.4% |
| Scotch-Irish | 98.8 /100 | #88 | Exceptional 92.4% |
| Canadians | 98.7 /100 | #89 | Exceptional 92.4% |
| Immigrants | Serbia | 98.6 /100 | #90 | Exceptional 92.4% |
| South Africans | 98.6 /100 | #91 | Exceptional 92.4% |
| Immigrants | Romania | 98.5 /100 | #92 | Exceptional 92.3% |
| Immigrants | Western Europe | 98.5 /100 | #93 | Exceptional 92.3% |
| Immigrants | Europe | 98.5 /100 | #94 | Exceptional 92.3% |
| Immigrants | North Macedonia | 98.5 /100 | #95 | Exceptional 92.3% |
Demographics Similar to Immigrants from Ireland by 12th Grade, No Diploma
In terms of 12th grade, no diploma, the demographic groups most similar to Immigrants from Ireland are European (93.1%, a difference of 0.010%), Iranian (93.1%, a difference of 0.020%), Immigrants from Lithuania (93.1%, a difference of 0.020%), Immigrants from Northern Europe (93.1%, a difference of 0.030%), and Immigrants from Scotland (93.0%, a difference of 0.050%).
| Demographics | Rating | Rank | 12th Grade, No Diploma |
| Thais | 99.9 /100 | #24 | Exceptional 93.2% |
| Czechs | 99.9 /100 | #25 | Exceptional 93.2% |
| Russians | 99.9 /100 | #26 | Exceptional 93.2% |
| Cypriots | 99.9 /100 | #27 | Exceptional 93.1% |
| Immigrants | Northern Europe | 99.9 /100 | #28 | Exceptional 93.1% |
| Iranians | 99.9 /100 | #29 | Exceptional 93.1% |
| Immigrants | Lithuania | 99.9 /100 | #30 | Exceptional 93.1% |
| Immigrants | Ireland | 99.9 /100 | #31 | Exceptional 93.1% |
| Europeans | 99.9 /100 | #32 | Exceptional 93.1% |
| Immigrants | Scotland | 99.9 /100 | #33 | Exceptional 93.0% |
| Okinawans | 99.9 /100 | #34 | Exceptional 93.0% |
| English | 99.9 /100 | #35 | Exceptional 93.0% |
| Scottish | 99.9 /100 | #36 | Exceptional 93.0% |
| Irish | 99.9 /100 | #37 | Exceptional 93.0% |
| Tlingit-Haida | 99.8 /100 | #38 | Exceptional 93.0% |