Immigrants from Sri Lanka vs Peruvian 12th Grade, No Diploma
COMPARE
Immigrants from Sri Lanka
Peruvian
12th Grade, No Diploma
12th Grade, No Diploma Comparison
Immigrants from Sri Lanka
Peruvians
92.1%
12TH GRADE, NO DIPLOMA
96.4/ 100
METRIC RATING
115th/ 347
METRIC RANK
90.2%
12TH GRADE, NO DIPLOMA
2.7/ 100
METRIC RATING
231st/ 347
METRIC RANK
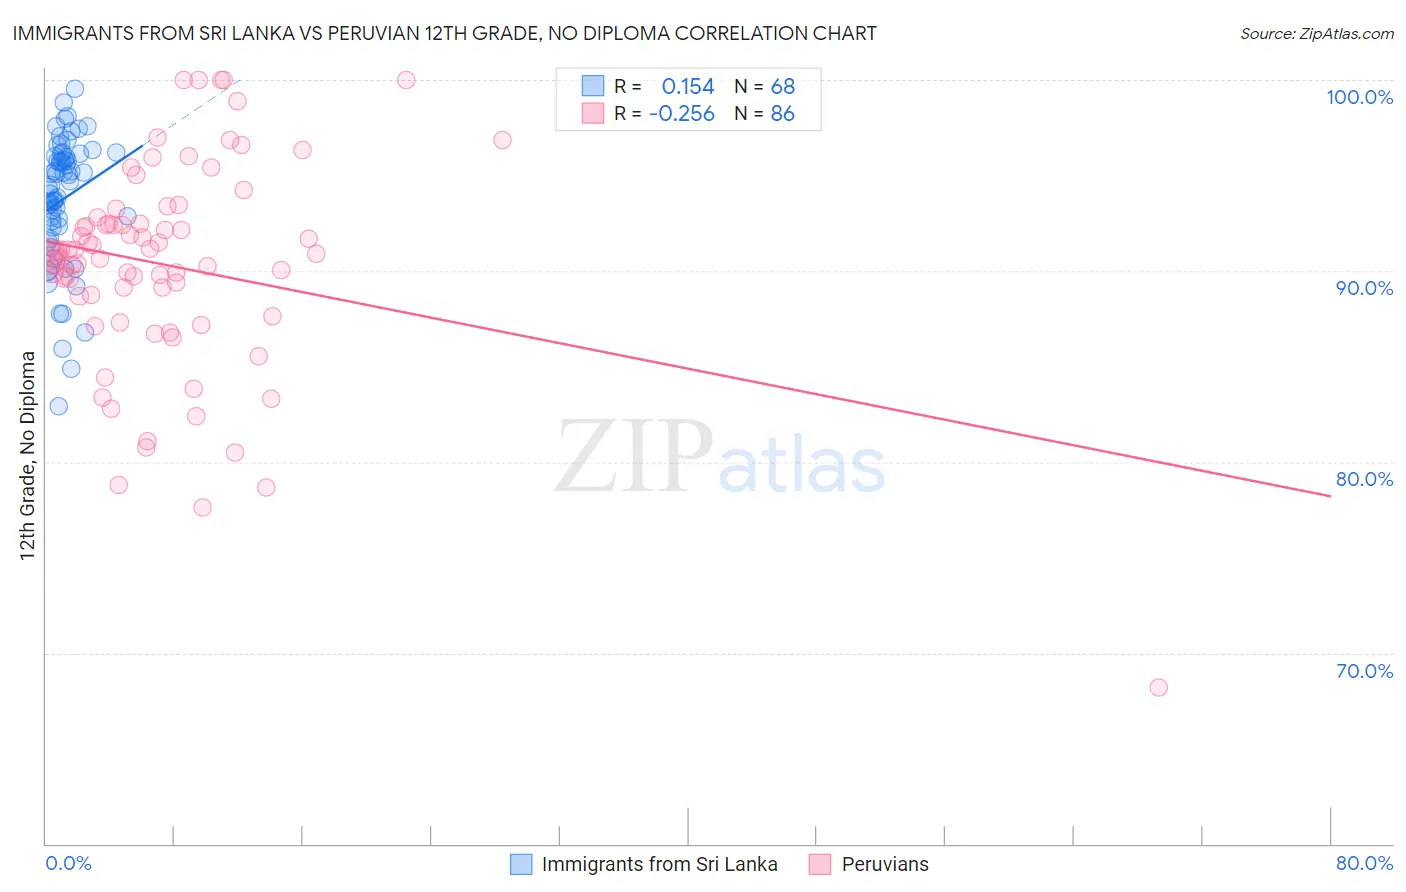
Immigrants from Sri Lanka vs Peruvian 12th Grade, No Diploma Correlation Chart
The statistical analysis conducted on geographies consisting of 149,699,055 people shows a poor positive correlation between the proportion of Immigrants from Sri Lanka and percentage of population with at least 12th grade (no diploma) education in the United States with a correlation coefficient (R) of 0.154 and weighted average of 92.1%. Similarly, the statistical analysis conducted on geographies consisting of 363,251,075 people shows a weak negative correlation between the proportion of Peruvians and percentage of population with at least 12th grade (no diploma) education in the United States with a correlation coefficient (R) of -0.256 and weighted average of 90.2%, a difference of 2.1%.
12th Grade, No Diploma Correlation Summary
| Measurement | Immigrants from Sri Lanka | Peruvian |
| Minimum | 82.9% | 68.2% |
| Maximum | 99.6% | 100.0% |
| Range | 16.6% | 31.8% |
| Mean | 93.8% | 90.3% |
| Median | 94.6% | 90.9% |
| Interquartile 25% (IQ1) | 92.3% | 88.7% |
| Interquartile 75% (IQ3) | 96.1% | 92.5% |
| Interquartile Range (IQR) | 3.8% | 3.8% |
| Standard Deviation (Sample) | 3.4% | 5.5% |
| Standard Deviation (Population) | 3.4% | 5.5% |
Similar Demographics by 12th Grade, No Diploma
Demographics Similar to Immigrants from Sri Lanka by 12th Grade, No Diploma
In terms of 12th grade, no diploma, the demographic groups most similar to Immigrants from Sri Lanka are Immigrants from Zimbabwe (92.1%, a difference of 0.010%), Yugoslavian (92.1%, a difference of 0.010%), Aleut (92.1%, a difference of 0.010%), Immigrants from Eastern Europe (92.1%, a difference of 0.010%), and Israeli (92.1%, a difference of 0.040%).
| Demographics | Rating | Rank | 12th Grade, No Diploma |
| Jordanians | 97.2 /100 | #108 | Exceptional 92.2% |
| Immigrants | Hungary | 97.0 /100 | #109 | Exceptional 92.1% |
| Palestinians | 97.0 /100 | #110 | Exceptional 92.1% |
| Immigrants | Greece | 96.9 /100 | #111 | Exceptional 92.1% |
| Israelis | 96.8 /100 | #112 | Exceptional 92.1% |
| Immigrants | Zimbabwe | 96.5 /100 | #113 | Exceptional 92.1% |
| Yugoslavians | 96.5 /100 | #114 | Exceptional 92.1% |
| Immigrants | Sri Lanka | 96.4 /100 | #115 | Exceptional 92.1% |
| Aleuts | 96.3 /100 | #116 | Exceptional 92.1% |
| Immigrants | Eastern Europe | 96.3 /100 | #117 | Exceptional 92.1% |
| Puget Sound Salish | 95.8 /100 | #118 | Exceptional 92.0% |
| Immigrants | Germany | 95.5 /100 | #119 | Exceptional 92.0% |
| Immigrants | Kazakhstan | 94.2 /100 | #120 | Exceptional 91.9% |
| Menominee | 93.5 /100 | #121 | Exceptional 91.9% |
| Ottawa | 93.1 /100 | #122 | Exceptional 91.9% |
Demographics Similar to Peruvians by 12th Grade, No Diploma
In terms of 12th grade, no diploma, the demographic groups most similar to Peruvians are Immigrants from Philippines (90.2%, a difference of 0.010%), Blackfeet (90.1%, a difference of 0.030%), Immigrants from Thailand (90.1%, a difference of 0.050%), Immigrants from South America (90.1%, a difference of 0.050%), and Colville (90.1%, a difference of 0.050%).
| Demographics | Rating | Rank | 12th Grade, No Diploma |
| Immigrants | Panama | 4.8 /100 | #224 | Tragic 90.3% |
| Chickasaw | 4.8 /100 | #225 | Tragic 90.3% |
| Immigrants | Zaire | 4.6 /100 | #226 | Tragic 90.3% |
| Nigerians | 4.5 /100 | #227 | Tragic 90.3% |
| Creek | 3.9 /100 | #228 | Tragic 90.3% |
| Immigrants | Bahamas | 3.6 /100 | #229 | Tragic 90.2% |
| Immigrants | Philippines | 2.8 /100 | #230 | Tragic 90.2% |
| Peruvians | 2.7 /100 | #231 | Tragic 90.2% |
| Blackfeet | 2.4 /100 | #232 | Tragic 90.1% |
| Immigrants | Thailand | 2.3 /100 | #233 | Tragic 90.1% |
| Immigrants | South America | 2.3 /100 | #234 | Tragic 90.1% |
| Colville | 2.3 /100 | #235 | Tragic 90.1% |
| Immigrants | Uzbekistan | 2.2 /100 | #236 | Tragic 90.1% |
| Immigrants | Colombia | 2.1 /100 | #237 | Tragic 90.1% |
| Inupiat | 2.0 /100 | #238 | Tragic 90.1% |