Immigrants from Lebanon vs Macedonian 10th Grade
COMPARE
Immigrants from Lebanon
Macedonian
10th Grade
10th Grade Comparison
Immigrants from Lebanon
Macedonians
93.7%
10TH GRADE
47.1/ 100
METRIC RATING
177th/ 347
METRIC RANK
95.2%
10TH GRADE
99.9/ 100
METRIC RATING
43rd/ 347
METRIC RANK
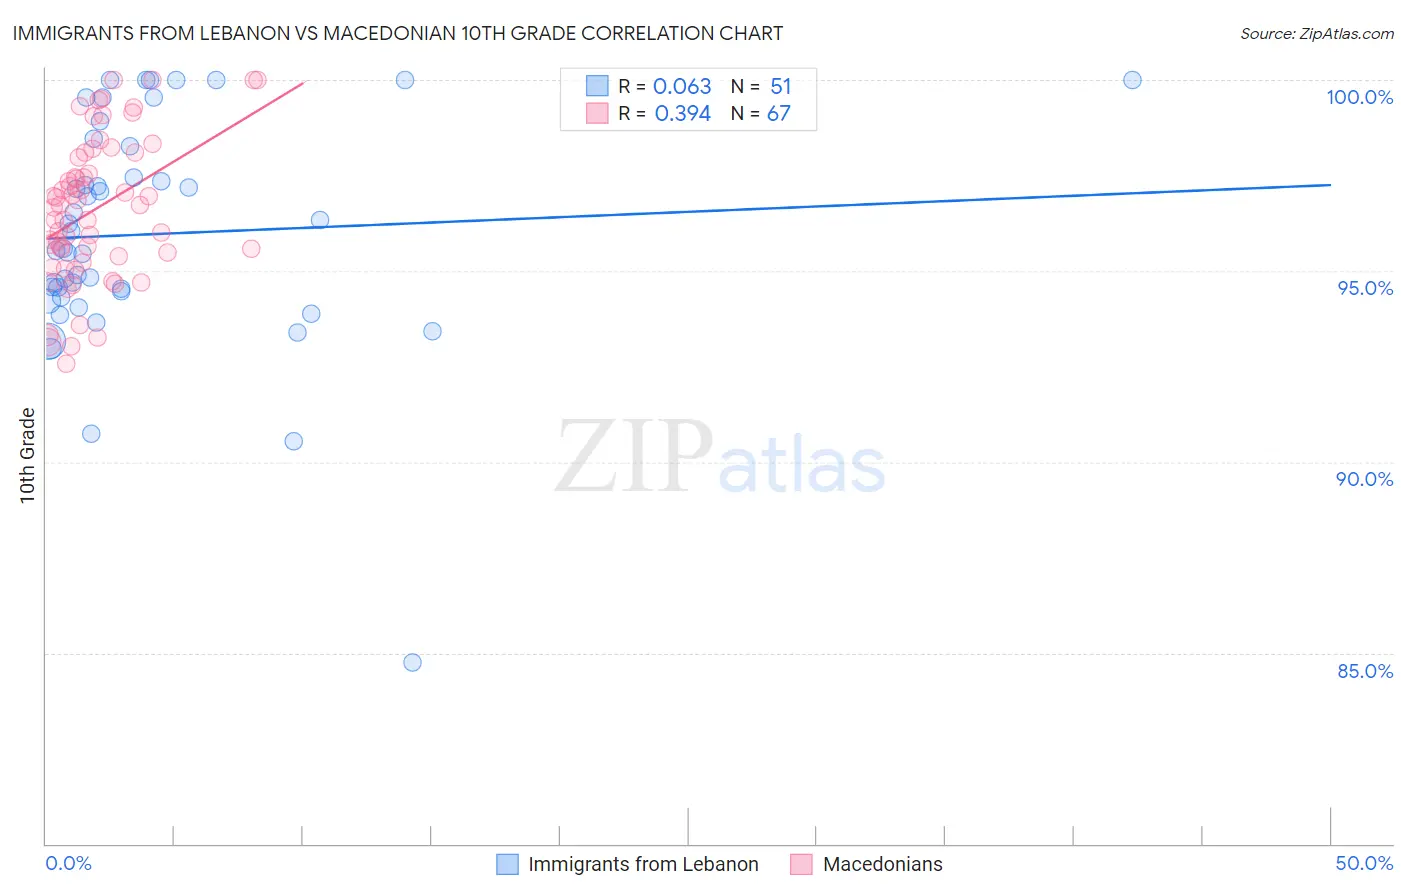
Immigrants from Lebanon vs Macedonian 10th Grade Correlation Chart
The statistical analysis conducted on geographies consisting of 217,083,357 people shows a slight positive correlation between the proportion of Immigrants from Lebanon and percentage of population with at least 10th grade education in the United States with a correlation coefficient (R) of 0.063 and weighted average of 93.7%. Similarly, the statistical analysis conducted on geographies consisting of 132,581,663 people shows a mild positive correlation between the proportion of Macedonians and percentage of population with at least 10th grade education in the United States with a correlation coefficient (R) of 0.394 and weighted average of 95.2%, a difference of 1.5%.
10th Grade Correlation Summary
| Measurement | Immigrants from Lebanon | Macedonian |
| Minimum | 84.7% | 92.6% |
| Maximum | 100.0% | 100.0% |
| Range | 15.3% | 7.4% |
| Mean | 96.0% | 96.6% |
| Median | 95.6% | 96.7% |
| Interquartile 25% (IQ1) | 94.3% | 95.4% |
| Interquartile 75% (IQ3) | 98.3% | 98.1% |
| Interquartile Range (IQR) | 4.0% | 2.7% |
| Standard Deviation (Sample) | 3.0% | 1.9% |
| Standard Deviation (Population) | 2.9% | 1.9% |
Similar Demographics by 10th Grade
Demographics Similar to Immigrants from Lebanon by 10th Grade
In terms of 10th grade, the demographic groups most similar to Immigrants from Lebanon are Immigrants from Argentina (93.7%, a difference of 0.0%), Sierra Leonean (93.7%, a difference of 0.010%), Immigrants from Nepal (93.7%, a difference of 0.020%), Paraguayan (93.7%, a difference of 0.020%), and French American Indian (93.7%, a difference of 0.030%).
| Demographics | Rating | Rank | 10th Grade |
| Immigrants | Venezuela | 53.9 /100 | #170 | Average 93.8% |
| Immigrants | Albania | 52.4 /100 | #171 | Average 93.8% |
| French American Indians | 50.9 /100 | #172 | Average 93.7% |
| Spaniards | 50.3 /100 | #173 | Average 93.7% |
| Argentineans | 50.0 /100 | #174 | Average 93.7% |
| Immigrants | Nepal | 49.6 /100 | #175 | Average 93.7% |
| Immigrants | Argentina | 47.1 /100 | #176 | Average 93.7% |
| Immigrants | Lebanon | 47.1 /100 | #177 | Average 93.7% |
| Sierra Leoneans | 46.1 /100 | #178 | Average 93.7% |
| Paraguayans | 45.3 /100 | #179 | Average 93.7% |
| Blackfeet | 42.8 /100 | #180 | Average 93.7% |
| Immigrants | Northern Africa | 41.6 /100 | #181 | Average 93.7% |
| Colville | 38.8 /100 | #182 | Fair 93.6% |
| Guamanians/Chamorros | 37.1 /100 | #183 | Fair 93.6% |
| Choctaw | 36.6 /100 | #184 | Fair 93.6% |
Demographics Similar to Macedonians by 10th Grade
In terms of 10th grade, the demographic groups most similar to Macedonians are Immigrants from Northern Europe (95.2%, a difference of 0.010%), Greek (95.2%, a difference of 0.010%), Slavic (95.2%, a difference of 0.020%), Czechoslovakian (95.1%, a difference of 0.020%), and Serbian (95.1%, a difference of 0.030%).
| Demographics | Rating | Rank | 10th Grade |
| Immigrants | India | 99.9 /100 | #36 | Exceptional 95.3% |
| French Canadians | 99.9 /100 | #37 | Exceptional 95.3% |
| Northern Europeans | 99.9 /100 | #38 | Exceptional 95.3% |
| Immigrants | Scotland | 99.9 /100 | #39 | Exceptional 95.2% |
| Scotch-Irish | 99.9 /100 | #40 | Exceptional 95.2% |
| Russians | 99.9 /100 | #41 | Exceptional 95.2% |
| Slavs | 99.9 /100 | #42 | Exceptional 95.2% |
| Macedonians | 99.9 /100 | #43 | Exceptional 95.2% |
| Immigrants | Northern Europe | 99.9 /100 | #44 | Exceptional 95.2% |
| Greeks | 99.9 /100 | #45 | Exceptional 95.2% |
| Czechoslovakians | 99.9 /100 | #46 | Exceptional 95.1% |
| Serbians | 99.9 /100 | #47 | Exceptional 95.1% |
| Australians | 99.9 /100 | #48 | Exceptional 95.1% |
| Immigrants | Austria | 99.9 /100 | #49 | Exceptional 95.1% |
| Immigrants | Canada | 99.8 /100 | #50 | Exceptional 95.1% |