U.S. Virgin Islander vs Macedonian 10th Grade
COMPARE
U.S. Virgin Islander
Macedonian
10th Grade
10th Grade Comparison
U.S. Virgin Islanders
Macedonians
92.7%
10TH GRADE
0.7/ 100
METRIC RATING
257th/ 347
METRIC RANK
95.2%
10TH GRADE
99.9/ 100
METRIC RATING
43rd/ 347
METRIC RANK
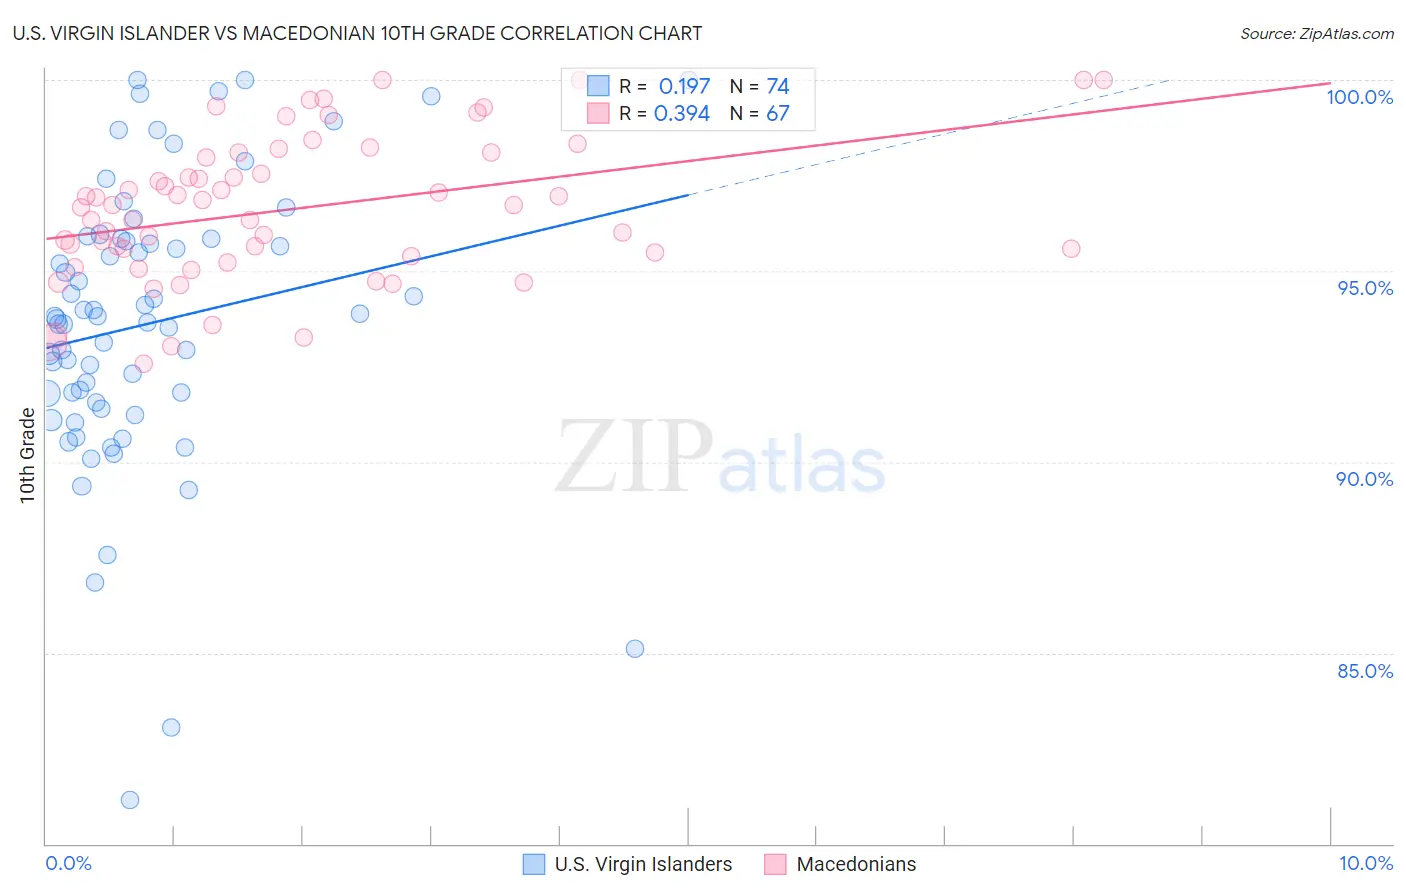
U.S. Virgin Islander vs Macedonian 10th Grade Correlation Chart
The statistical analysis conducted on geographies consisting of 87,529,315 people shows a poor positive correlation between the proportion of U.S. Virgin Islanders and percentage of population with at least 10th grade education in the United States with a correlation coefficient (R) of 0.197 and weighted average of 92.7%. Similarly, the statistical analysis conducted on geographies consisting of 132,581,663 people shows a mild positive correlation between the proportion of Macedonians and percentage of population with at least 10th grade education in the United States with a correlation coefficient (R) of 0.394 and weighted average of 95.2%, a difference of 2.7%.
10th Grade Correlation Summary
| Measurement | U.S. Virgin Islander | Macedonian |
| Minimum | 81.1% | 92.6% |
| Maximum | 100.0% | 100.0% |
| Range | 18.9% | 7.4% |
| Mean | 93.6% | 96.6% |
| Median | 93.8% | 96.7% |
| Interquartile 25% (IQ1) | 91.6% | 95.4% |
| Interquartile 75% (IQ3) | 95.8% | 98.1% |
| Interquartile Range (IQR) | 4.3% | 2.7% |
| Standard Deviation (Sample) | 3.7% | 1.9% |
| Standard Deviation (Population) | 3.7% | 1.9% |
Similar Demographics by 10th Grade
Demographics Similar to U.S. Virgin Islanders by 10th Grade
In terms of 10th grade, the demographic groups most similar to U.S. Virgin Islanders are Immigrants from Nigeria (92.7%, a difference of 0.010%), Immigrants from Costa Rica (92.7%, a difference of 0.010%), Immigrants from Bolivia (92.7%, a difference of 0.020%), Immigrants from Jamaica (92.6%, a difference of 0.040%), and Immigrants from Uzbekistan (92.6%, a difference of 0.060%).
| Demographics | Rating | Rank | 10th Grade |
| Jamaicans | 1.2 /100 | #250 | Tragic 92.8% |
| Immigrants | Thailand | 1.0 /100 | #251 | Tragic 92.8% |
| South Americans | 0.9 /100 | #252 | Tragic 92.8% |
| Ghanaians | 0.9 /100 | #253 | Tragic 92.8% |
| Armenians | 0.9 /100 | #254 | Tragic 92.7% |
| Immigrants | Bolivia | 0.7 /100 | #255 | Tragic 92.7% |
| Immigrants | Nigeria | 0.7 /100 | #256 | Tragic 92.7% |
| U.S. Virgin Islanders | 0.7 /100 | #257 | Tragic 92.7% |
| Immigrants | Costa Rica | 0.6 /100 | #258 | Tragic 92.7% |
| Immigrants | Jamaica | 0.5 /100 | #259 | Tragic 92.6% |
| Immigrants | Uzbekistan | 0.5 /100 | #260 | Tragic 92.6% |
| Paiute | 0.4 /100 | #261 | Tragic 92.6% |
| Immigrants | South America | 0.4 /100 | #262 | Tragic 92.6% |
| Apache | 0.4 /100 | #263 | Tragic 92.6% |
| Peruvians | 0.4 /100 | #264 | Tragic 92.6% |
Demographics Similar to Macedonians by 10th Grade
In terms of 10th grade, the demographic groups most similar to Macedonians are Immigrants from Northern Europe (95.2%, a difference of 0.010%), Greek (95.2%, a difference of 0.010%), Slavic (95.2%, a difference of 0.020%), Czechoslovakian (95.1%, a difference of 0.020%), and Serbian (95.1%, a difference of 0.030%).
| Demographics | Rating | Rank | 10th Grade |
| Immigrants | India | 99.9 /100 | #36 | Exceptional 95.3% |
| French Canadians | 99.9 /100 | #37 | Exceptional 95.3% |
| Northern Europeans | 99.9 /100 | #38 | Exceptional 95.3% |
| Immigrants | Scotland | 99.9 /100 | #39 | Exceptional 95.2% |
| Scotch-Irish | 99.9 /100 | #40 | Exceptional 95.2% |
| Russians | 99.9 /100 | #41 | Exceptional 95.2% |
| Slavs | 99.9 /100 | #42 | Exceptional 95.2% |
| Macedonians | 99.9 /100 | #43 | Exceptional 95.2% |
| Immigrants | Northern Europe | 99.9 /100 | #44 | Exceptional 95.2% |
| Greeks | 99.9 /100 | #45 | Exceptional 95.2% |
| Czechoslovakians | 99.9 /100 | #46 | Exceptional 95.1% |
| Serbians | 99.9 /100 | #47 | Exceptional 95.1% |
| Australians | 99.9 /100 | #48 | Exceptional 95.1% |
| Immigrants | Austria | 99.9 /100 | #49 | Exceptional 95.1% |
| Immigrants | Canada | 99.8 /100 | #50 | Exceptional 95.1% |