Scotch-Irish vs Immigrants from Ireland 9th Grade
COMPARE
Scotch-Irish
Immigrants from Ireland
9th Grade
9th Grade Comparison
Scotch-Irish
Immigrants from Ireland
96.3%
9TH GRADE
100.0/ 100
METRIC RATING
27th/ 347
METRIC RANK
95.8%
9TH GRADE
99.6/ 100
METRIC RATING
68th/ 347
METRIC RANK
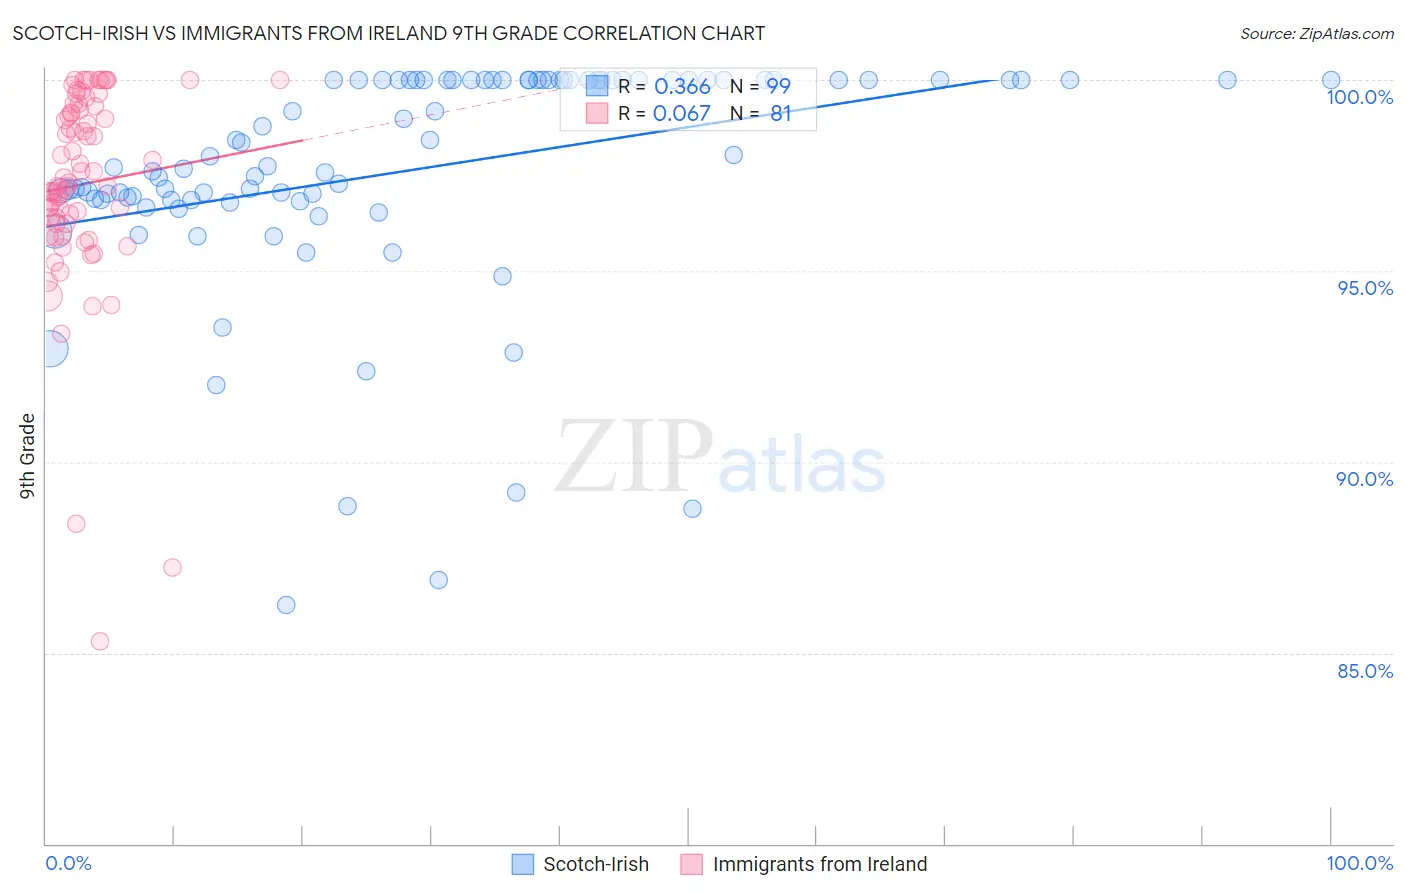
Scotch-Irish vs Immigrants from Ireland 9th Grade Correlation Chart
The statistical analysis conducted on geographies consisting of 548,780,564 people shows a mild positive correlation between the proportion of Scotch-Irish and percentage of population with at least 9th grade education in the United States with a correlation coefficient (R) of 0.366 and weighted average of 96.3%. Similarly, the statistical analysis conducted on geographies consisting of 240,784,498 people shows a slight positive correlation between the proportion of Immigrants from Ireland and percentage of population with at least 9th grade education in the United States with a correlation coefficient (R) of 0.067 and weighted average of 95.8%, a difference of 0.49%.
9th Grade Correlation Summary
| Measurement | Scotch-Irish | Immigrants from Ireland |
| Minimum | 86.2% | 85.3% |
| Maximum | 100.0% | 100.0% |
| Range | 13.8% | 14.7% |
| Mean | 97.7% | 97.3% |
| Median | 98.0% | 97.3% |
| Interquartile 25% (IQ1) | 96.9% | 96.2% |
| Interquartile 75% (IQ3) | 100.0% | 99.3% |
| Interquartile Range (IQR) | 3.1% | 3.0% |
| Standard Deviation (Sample) | 3.0% | 2.7% |
| Standard Deviation (Population) | 3.0% | 2.7% |
Similar Demographics by 9th Grade
Demographics Similar to Scotch-Irish by 9th Grade
In terms of 9th grade, the demographic groups most similar to Scotch-Irish are Eastern European (96.3%, a difference of 0.0%), Chinese (96.3%, a difference of 0.0%), French Canadian (96.3%, a difference of 0.010%), Maltese (96.3%, a difference of 0.030%), and British (96.3%, a difference of 0.030%).
| Demographics | Rating | Rank | 9th Grade |
| Italians | 100.0 /100 | #20 | Exceptional 96.4% |
| Alaskan Athabascans | 100.0 /100 | #21 | Exceptional 96.4% |
| Europeans | 100.0 /100 | #22 | Exceptional 96.4% |
| Czechs | 100.0 /100 | #23 | Exceptional 96.4% |
| Latvians | 100.0 /100 | #24 | Exceptional 96.4% |
| French | 100.0 /100 | #25 | Exceptional 96.3% |
| French Canadians | 100.0 /100 | #26 | Exceptional 96.3% |
| Scotch-Irish | 100.0 /100 | #27 | Exceptional 96.3% |
| Eastern Europeans | 100.0 /100 | #28 | Exceptional 96.3% |
| Chinese | 100.0 /100 | #29 | Exceptional 96.3% |
| Maltese | 100.0 /100 | #30 | Exceptional 96.3% |
| British | 100.0 /100 | #31 | Exceptional 96.3% |
| Belgians | 100.0 /100 | #32 | Exceptional 96.3% |
| Luxembourgers | 100.0 /100 | #33 | Exceptional 96.3% |
| Hungarians | 100.0 /100 | #34 | Exceptional 96.2% |
Demographics Similar to Immigrants from Ireland by 9th Grade
In terms of 9th grade, the demographic groups most similar to Immigrants from Ireland are Cypriot (95.8%, a difference of 0.0%), Immigrants from Lithuania (95.8%, a difference of 0.0%), Immigrants from Netherlands (95.8%, a difference of 0.010%), Immigrants from Australia (95.8%, a difference of 0.020%), and Immigrants from Belgium (95.8%, a difference of 0.020%).
| Demographics | Rating | Rank | 9th Grade |
| Sioux | 99.8 /100 | #61 | Exceptional 95.9% |
| Ukrainians | 99.7 /100 | #62 | Exceptional 95.9% |
| Canadians | 99.7 /100 | #63 | Exceptional 95.9% |
| Zimbabweans | 99.7 /100 | #64 | Exceptional 95.9% |
| Immigrants | England | 99.6 /100 | #65 | Exceptional 95.9% |
| Immigrants | Netherlands | 99.6 /100 | #66 | Exceptional 95.8% |
| Cypriots | 99.6 /100 | #67 | Exceptional 95.8% |
| Immigrants | Ireland | 99.6 /100 | #68 | Exceptional 95.8% |
| Immigrants | Lithuania | 99.6 /100 | #69 | Exceptional 95.8% |
| Immigrants | Australia | 99.5 /100 | #70 | Exceptional 95.8% |
| Immigrants | Belgium | 99.5 /100 | #71 | Exceptional 95.8% |
| Turks | 99.5 /100 | #72 | Exceptional 95.8% |
| Immigrants | Singapore | 99.5 /100 | #73 | Exceptional 95.8% |
| Thais | 99.5 /100 | #74 | Exceptional 95.8% |
| Inupiat | 99.5 /100 | #75 | Exceptional 95.8% |