Central American Indian vs Houma Professional Degree
COMPARE
Central American Indian
Houma
Professional Degree
Professional Degree Comparison
Central American Indians
Houma
3.6%
PROFESSIONAL DEGREE
0.8/ 100
METRIC RATING
266th/ 347
METRIC RANK
2.2%
PROFESSIONAL DEGREE
0.0/ 100
METRIC RATING
347th/ 347
METRIC RANK
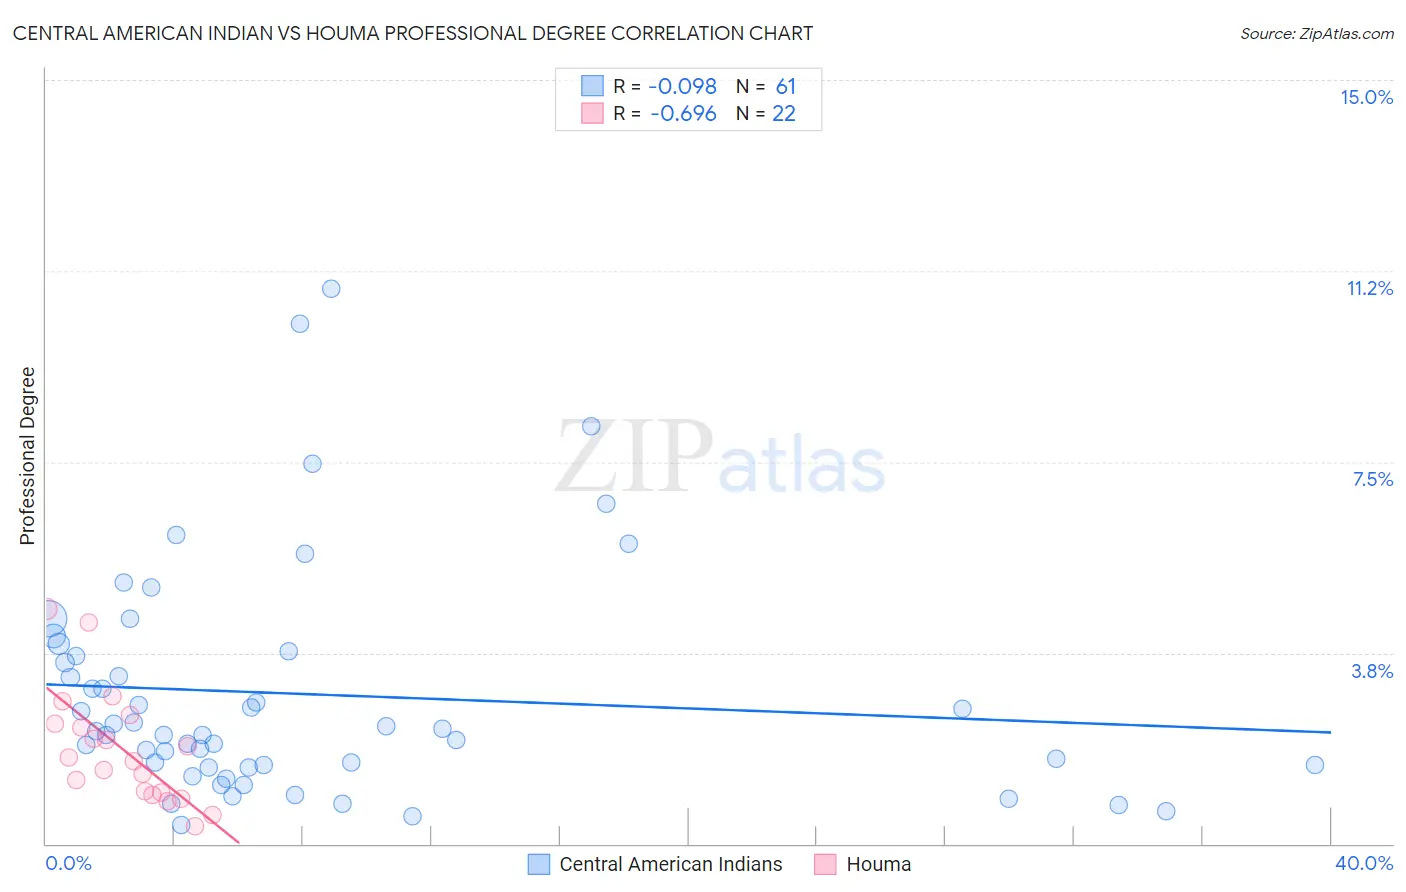
Central American Indian vs Houma Professional Degree Correlation Chart
The statistical analysis conducted on geographies consisting of 325,494,911 people shows a slight negative correlation between the proportion of Central American Indians and percentage of population with at least professional degree education in the United States with a correlation coefficient (R) of -0.098 and weighted average of 3.6%. Similarly, the statistical analysis conducted on geographies consisting of 36,689,629 people shows a significant negative correlation between the proportion of Houma and percentage of population with at least professional degree education in the United States with a correlation coefficient (R) of -0.696 and weighted average of 2.2%, a difference of 63.9%.
Professional Degree Correlation Summary
| Measurement | Central American Indian | Houma |
| Minimum | 0.37% | 0.35% |
| Maximum | 10.9% | 4.6% |
| Range | 10.5% | 4.3% |
| Mean | 2.9% | 1.9% |
| Median | 2.2% | 1.7% |
| Interquartile 25% (IQ1) | 1.5% | 1.0% |
| Interquartile 75% (IQ3) | 3.7% | 2.4% |
| Interquartile Range (IQR) | 2.2% | 1.4% |
| Standard Deviation (Sample) | 2.2% | 1.1% |
| Standard Deviation (Population) | 2.2% | 1.1% |
Similar Demographics by Professional Degree
Demographics Similar to Central American Indians by Professional Degree
In terms of professional degree, the demographic groups most similar to Central American Indians are Delaware (3.6%, a difference of 0.26%), Immigrants from Congo (3.6%, a difference of 0.32%), Immigrants from Cambodia (3.6%, a difference of 0.36%), Hopi (3.6%, a difference of 0.38%), and Aleut (3.6%, a difference of 0.42%).
| Demographics | Rating | Rank | Professional Degree |
| Africans | 1.0 /100 | #259 | Tragic 3.7% |
| Indonesians | 1.0 /100 | #260 | Tragic 3.7% |
| Immigrants | Guyana | 1.0 /100 | #261 | Tragic 3.7% |
| U.S. Virgin Islanders | 1.0 /100 | #262 | Tragic 3.7% |
| Hopi | 0.9 /100 | #263 | Tragic 3.6% |
| Immigrants | Cambodia | 0.9 /100 | #264 | Tragic 3.6% |
| Immigrants | Congo | 0.8 /100 | #265 | Tragic 3.6% |
| Central American Indians | 0.8 /100 | #266 | Tragic 3.6% |
| Delaware | 0.7 /100 | #267 | Tragic 3.6% |
| Aleuts | 0.7 /100 | #268 | Tragic 3.6% |
| Immigrants | Cuba | 0.6 /100 | #269 | Tragic 3.6% |
| Central Americans | 0.6 /100 | #270 | Tragic 3.6% |
| Belizeans | 0.5 /100 | #271 | Tragic 3.6% |
| Immigrants | Jamaica | 0.5 /100 | #272 | Tragic 3.6% |
| Americans | 0.5 /100 | #273 | Tragic 3.6% |
Demographics Similar to Houma by Professional Degree
In terms of professional degree, the demographic groups most similar to Houma are Lumbee (2.5%, a difference of 11.1%), Immigrants from Mexico (2.6%, a difference of 19.3%), Spanish American Indian (2.7%, a difference of 19.7%), Mexican (2.7%, a difference of 24.0%), and Immigrants from the Azores (2.8%, a difference of 27.6%).
| Demographics | Rating | Rank | Professional Degree |
| Puget Sound Salish | 0.0 /100 | #333 | Tragic 3.1% |
| Pennsylvania Germans | 0.0 /100 | #334 | Tragic 3.0% |
| Natives/Alaskans | 0.0 /100 | #335 | Tragic 3.0% |
| Fijians | 0.0 /100 | #336 | Tragic 2.9% |
| Arapaho | 0.0 /100 | #337 | Tragic 2.9% |
| Navajo | 0.0 /100 | #338 | Tragic 2.9% |
| Immigrants | Central America | 0.0 /100 | #339 | Tragic 2.9% |
| Yup'ik | 0.0 /100 | #340 | Tragic 2.9% |
| Tohono O'odham | 0.0 /100 | #341 | Tragic 2.8% |
| Immigrants | Azores | 0.0 /100 | #342 | Tragic 2.8% |
| Mexicans | 0.0 /100 | #343 | Tragic 2.7% |
| Spanish American Indians | 0.0 /100 | #344 | Tragic 2.7% |
| Immigrants | Mexico | 0.0 /100 | #345 | Tragic 2.6% |
| Lumbee | 0.0 /100 | #346 | Tragic 2.5% |
| Houma | 0.0 /100 | #347 | Tragic 2.2% |