Immigrants from Dominican Republic vs Houma Professional Degree
COMPARE
Immigrants from Dominican Republic
Houma
Professional Degree
Professional Degree Comparison
Immigrants from Dominican Republic
Houma
3.4%
PROFESSIONAL DEGREE
0.2/ 100
METRIC RATING
301st/ 347
METRIC RANK
2.2%
PROFESSIONAL DEGREE
0.0/ 100
METRIC RATING
347th/ 347
METRIC RANK
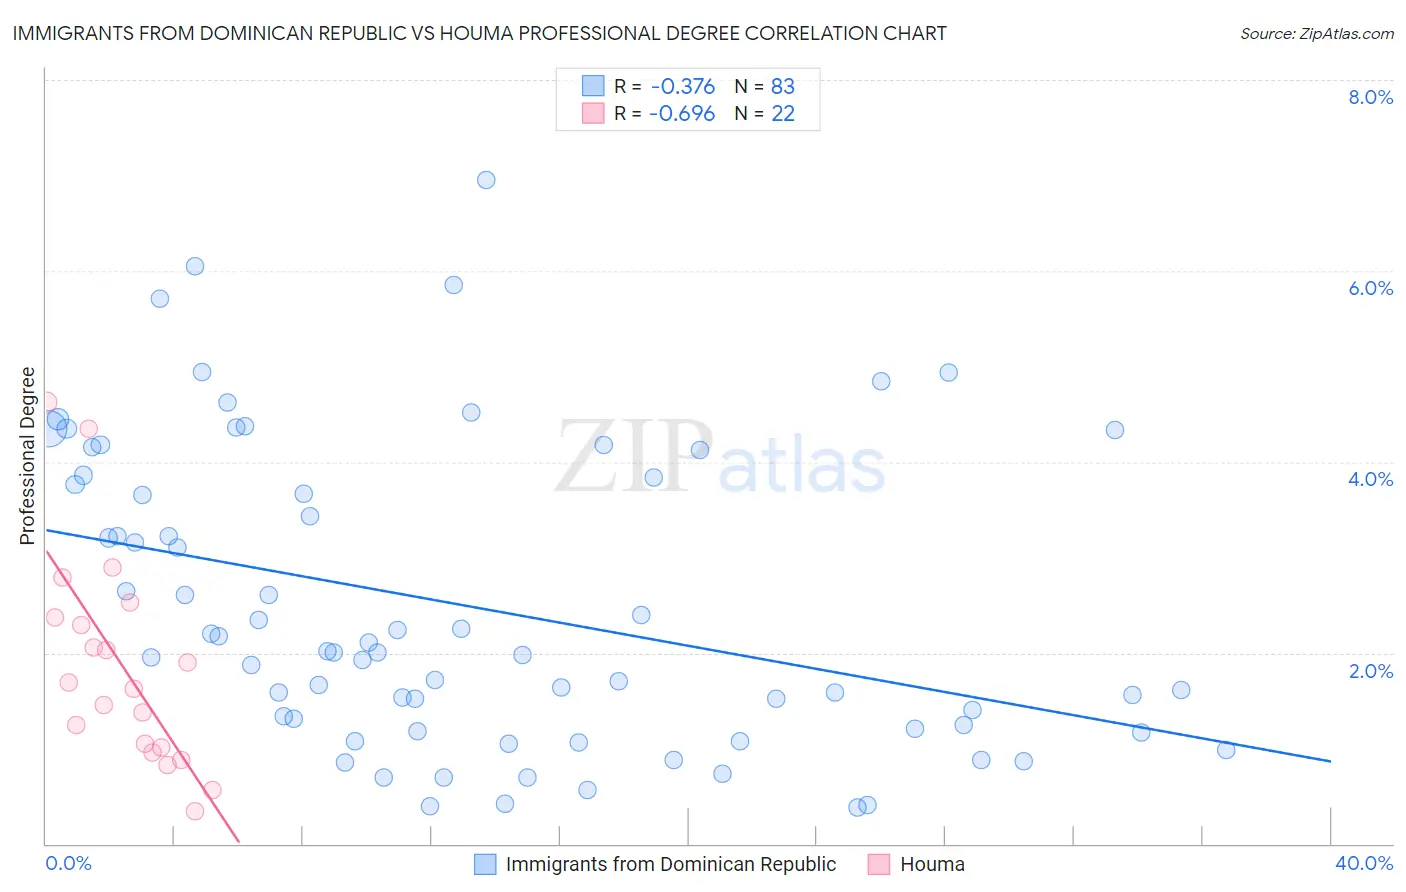
Immigrants from Dominican Republic vs Houma Professional Degree Correlation Chart
The statistical analysis conducted on geographies consisting of 274,641,839 people shows a mild negative correlation between the proportion of Immigrants from Dominican Republic and percentage of population with at least professional degree education in the United States with a correlation coefficient (R) of -0.376 and weighted average of 3.4%. Similarly, the statistical analysis conducted on geographies consisting of 36,689,629 people shows a significant negative correlation between the proportion of Houma and percentage of population with at least professional degree education in the United States with a correlation coefficient (R) of -0.696 and weighted average of 2.2%, a difference of 53.3%.
Professional Degree Correlation Summary
| Measurement | Immigrants from Dominican Republic | Houma |
| Minimum | 0.38% | 0.35% |
| Maximum | 7.0% | 4.6% |
| Range | 6.6% | 4.3% |
| Mean | 2.5% | 1.9% |
| Median | 2.0% | 1.7% |
| Interquartile 25% (IQ1) | 1.2% | 1.0% |
| Interquartile 75% (IQ3) | 3.8% | 2.4% |
| Interquartile Range (IQR) | 2.6% | 1.4% |
| Standard Deviation (Sample) | 1.6% | 1.1% |
| Standard Deviation (Population) | 1.6% | 1.1% |
Similar Demographics by Professional Degree
Demographics Similar to Immigrants from Dominican Republic by Professional Degree
In terms of professional degree, the demographic groups most similar to Immigrants from Dominican Republic are Malaysian (3.4%, a difference of 0.11%), Black/African American (3.4%, a difference of 0.14%), Immigrants from Yemen (3.4%, a difference of 0.28%), Immigrants from Haiti (3.4%, a difference of 0.76%), and Cajun (3.4%, a difference of 0.77%).
| Demographics | Rating | Rank | Professional Degree |
| Paiute | 0.3 /100 | #294 | Tragic 3.4% |
| Immigrants | Guatemala | 0.2 /100 | #295 | Tragic 3.4% |
| Hawaiians | 0.2 /100 | #296 | Tragic 3.4% |
| Immigrants | Liberia | 0.2 /100 | #297 | Tragic 3.4% |
| Ottawa | 0.2 /100 | #298 | Tragic 3.4% |
| Immigrants | Yemen | 0.2 /100 | #299 | Tragic 3.4% |
| Blacks/African Americans | 0.2 /100 | #300 | Tragic 3.4% |
| Immigrants | Dominican Republic | 0.2 /100 | #301 | Tragic 3.4% |
| Malaysians | 0.2 /100 | #302 | Tragic 3.4% |
| Immigrants | Haiti | 0.2 /100 | #303 | Tragic 3.4% |
| Cajuns | 0.2 /100 | #304 | Tragic 3.4% |
| Chickasaw | 0.1 /100 | #305 | Tragic 3.4% |
| Cape Verdeans | 0.1 /100 | #306 | Tragic 3.4% |
| Samoans | 0.1 /100 | #307 | Tragic 3.3% |
| Shoshone | 0.1 /100 | #308 | Tragic 3.3% |
Demographics Similar to Houma by Professional Degree
In terms of professional degree, the demographic groups most similar to Houma are Lumbee (2.5%, a difference of 11.1%), Immigrants from Mexico (2.6%, a difference of 19.3%), Spanish American Indian (2.7%, a difference of 19.7%), Mexican (2.7%, a difference of 24.0%), and Immigrants from the Azores (2.8%, a difference of 27.6%).
| Demographics | Rating | Rank | Professional Degree |
| Puget Sound Salish | 0.0 /100 | #333 | Tragic 3.1% |
| Pennsylvania Germans | 0.0 /100 | #334 | Tragic 3.0% |
| Natives/Alaskans | 0.0 /100 | #335 | Tragic 3.0% |
| Fijians | 0.0 /100 | #336 | Tragic 2.9% |
| Arapaho | 0.0 /100 | #337 | Tragic 2.9% |
| Navajo | 0.0 /100 | #338 | Tragic 2.9% |
| Immigrants | Central America | 0.0 /100 | #339 | Tragic 2.9% |
| Yup'ik | 0.0 /100 | #340 | Tragic 2.9% |
| Tohono O'odham | 0.0 /100 | #341 | Tragic 2.8% |
| Immigrants | Azores | 0.0 /100 | #342 | Tragic 2.8% |
| Mexicans | 0.0 /100 | #343 | Tragic 2.7% |
| Spanish American Indians | 0.0 /100 | #344 | Tragic 2.7% |
| Immigrants | Mexico | 0.0 /100 | #345 | Tragic 2.6% |
| Lumbee | 0.0 /100 | #346 | Tragic 2.5% |
| Houma | 0.0 /100 | #347 | Tragic 2.2% |