Immigrants from Caribbean vs Houma Professional Degree
COMPARE
Immigrants from Caribbean
Houma
Professional Degree
Professional Degree Comparison
Immigrants from Caribbean
Houma
3.5%
PROFESSIONAL DEGREE
0.5/ 100
METRIC RATING
282nd/ 347
METRIC RANK
2.2%
PROFESSIONAL DEGREE
0.0/ 100
METRIC RATING
347th/ 347
METRIC RANK
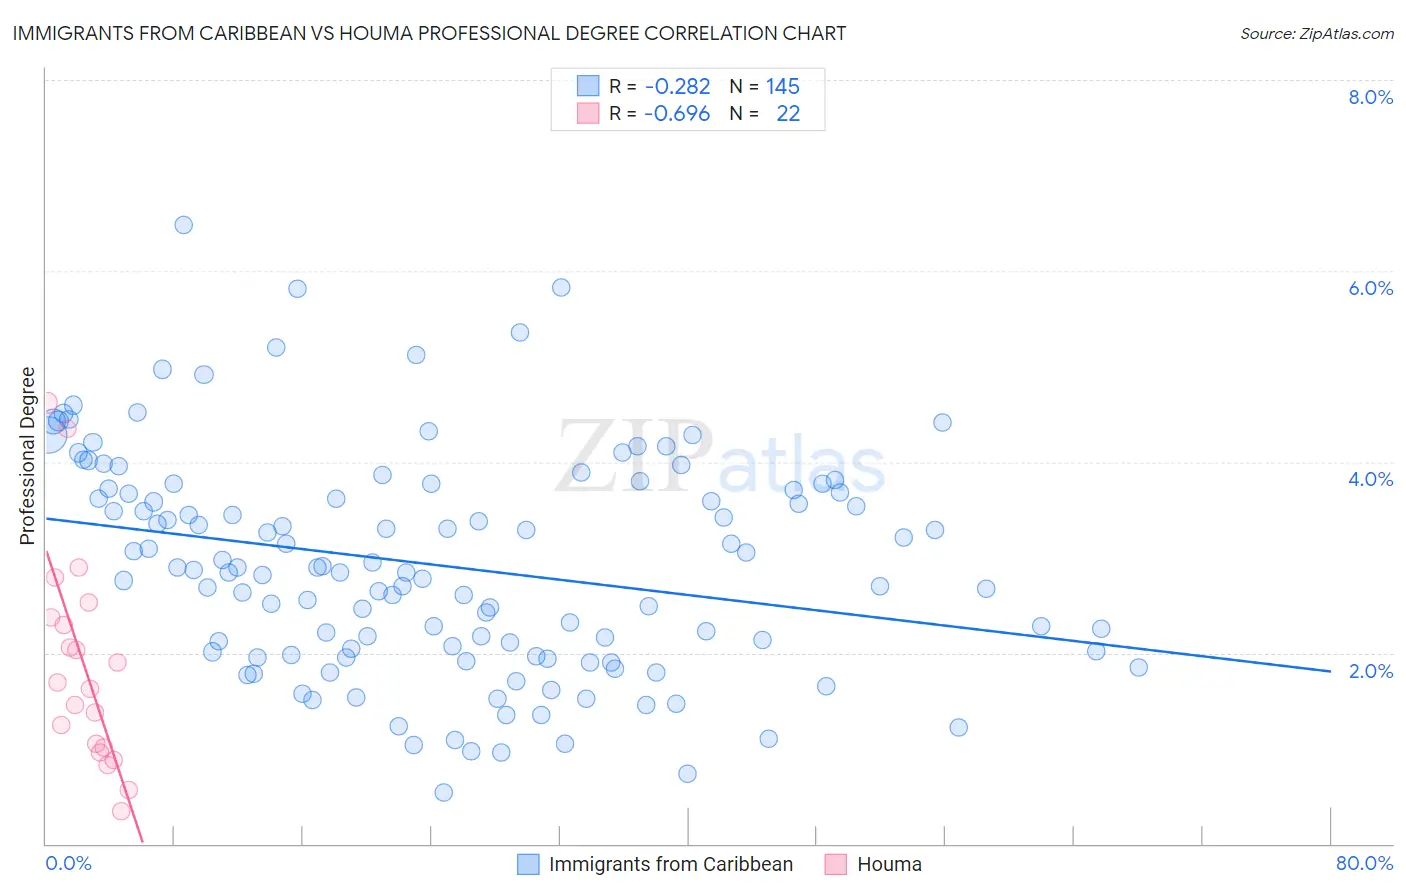
Immigrants from Caribbean vs Houma Professional Degree Correlation Chart
The statistical analysis conducted on geographies consisting of 448,523,190 people shows a weak negative correlation between the proportion of Immigrants from Caribbean and percentage of population with at least professional degree education in the United States with a correlation coefficient (R) of -0.282 and weighted average of 3.5%. Similarly, the statistical analysis conducted on geographies consisting of 36,689,629 people shows a significant negative correlation between the proportion of Houma and percentage of population with at least professional degree education in the United States with a correlation coefficient (R) of -0.696 and weighted average of 2.2%, a difference of 59.9%.
Professional Degree Correlation Summary
| Measurement | Immigrants from Caribbean | Houma |
| Minimum | 0.54% | 0.35% |
| Maximum | 6.5% | 4.6% |
| Range | 5.9% | 4.3% |
| Mean | 2.9% | 1.9% |
| Median | 2.9% | 1.7% |
| Interquartile 25% (IQ1) | 2.0% | 1.0% |
| Interquartile 75% (IQ3) | 3.7% | 2.4% |
| Interquartile Range (IQR) | 1.7% | 1.4% |
| Standard Deviation (Sample) | 1.2% | 1.1% |
| Standard Deviation (Population) | 1.1% | 1.1% |
Similar Demographics by Professional Degree
Demographics Similar to Immigrants from Caribbean by Professional Degree
In terms of professional degree, the demographic groups most similar to Immigrants from Caribbean are Apache (3.5%, a difference of 0.020%), Dominican (3.5%, a difference of 0.050%), Immigrants from Portugal (3.5%, a difference of 0.080%), Japanese (3.5%, a difference of 0.12%), and Cheyenne (3.6%, a difference of 0.18%).
| Demographics | Rating | Rank | Professional Degree |
| Immigrants | Dominica | 0.5 /100 | #275 | Tragic 3.6% |
| Liberians | 0.5 /100 | #276 | Tragic 3.6% |
| Cheyenne | 0.5 /100 | #277 | Tragic 3.6% |
| Japanese | 0.5 /100 | #278 | Tragic 3.5% |
| Immigrants | Portugal | 0.5 /100 | #279 | Tragic 3.5% |
| Dominicans | 0.5 /100 | #280 | Tragic 3.5% |
| Apache | 0.5 /100 | #281 | Tragic 3.5% |
| Immigrants | Caribbean | 0.5 /100 | #282 | Tragic 3.5% |
| Comanche | 0.4 /100 | #283 | Tragic 3.5% |
| Salvadorans | 0.4 /100 | #284 | Tragic 3.5% |
| Hondurans | 0.3 /100 | #285 | Tragic 3.5% |
| Haitians | 0.3 /100 | #286 | Tragic 3.5% |
| Immigrants | El Salvador | 0.3 /100 | #287 | Tragic 3.5% |
| Blackfeet | 0.3 /100 | #288 | Tragic 3.5% |
| Guatemalans | 0.3 /100 | #289 | Tragic 3.5% |
Demographics Similar to Houma by Professional Degree
In terms of professional degree, the demographic groups most similar to Houma are Lumbee (2.5%, a difference of 11.1%), Immigrants from Mexico (2.6%, a difference of 19.3%), Spanish American Indian (2.7%, a difference of 19.7%), Mexican (2.7%, a difference of 24.0%), and Immigrants from the Azores (2.8%, a difference of 27.6%).
| Demographics | Rating | Rank | Professional Degree |
| Puget Sound Salish | 0.0 /100 | #333 | Tragic 3.1% |
| Pennsylvania Germans | 0.0 /100 | #334 | Tragic 3.0% |
| Natives/Alaskans | 0.0 /100 | #335 | Tragic 3.0% |
| Fijians | 0.0 /100 | #336 | Tragic 2.9% |
| Arapaho | 0.0 /100 | #337 | Tragic 2.9% |
| Navajo | 0.0 /100 | #338 | Tragic 2.9% |
| Immigrants | Central America | 0.0 /100 | #339 | Tragic 2.9% |
| Yup'ik | 0.0 /100 | #340 | Tragic 2.9% |
| Tohono O'odham | 0.0 /100 | #341 | Tragic 2.8% |
| Immigrants | Azores | 0.0 /100 | #342 | Tragic 2.8% |
| Mexicans | 0.0 /100 | #343 | Tragic 2.7% |
| Spanish American Indians | 0.0 /100 | #344 | Tragic 2.7% |
| Immigrants | Mexico | 0.0 /100 | #345 | Tragic 2.6% |
| Lumbee | 0.0 /100 | #346 | Tragic 2.5% |
| Houma | 0.0 /100 | #347 | Tragic 2.2% |