Immigrants from Switzerland vs Serbian Doctorate Degree
COMPARE
Immigrants from Switzerland
Serbian
Doctorate Degree
Doctorate Degree Comparison
Immigrants from Switzerland
Serbians
3.1%
DOCTORATE DEGREE
100.0/ 100
METRIC RATING
6th/ 347
METRIC RANK
2.0%
DOCTORATE DEGREE
88.7/ 100
METRIC RATING
135th/ 347
METRIC RANK
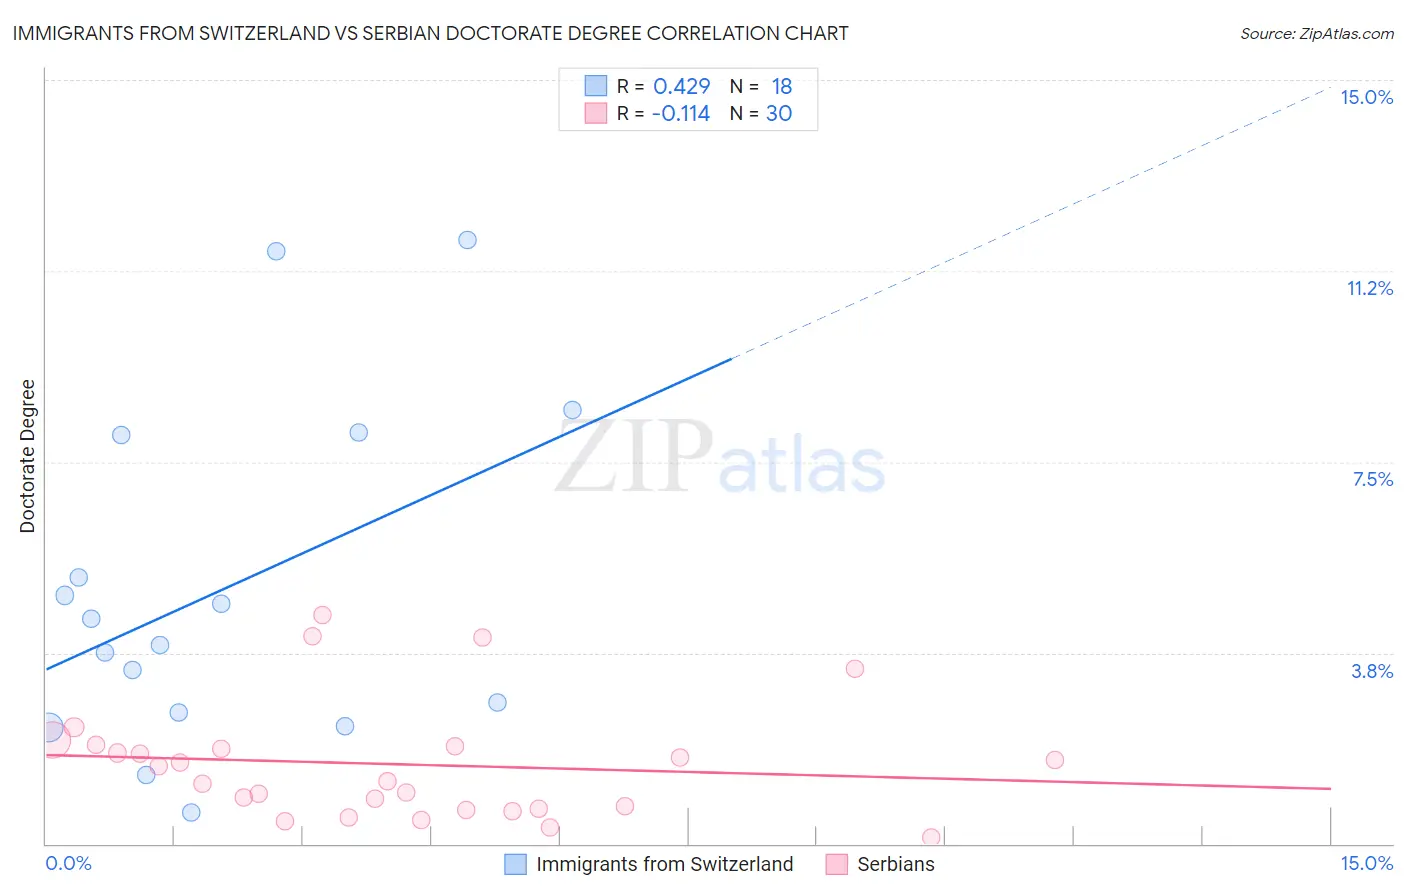
Immigrants from Switzerland vs Serbian Doctorate Degree Correlation Chart
The statistical analysis conducted on geographies consisting of 147,873,421 people shows a moderate positive correlation between the proportion of Immigrants from Switzerland and percentage of population with at least doctorate degree education in the United States with a correlation coefficient (R) of 0.429 and weighted average of 3.1%. Similarly, the statistical analysis conducted on geographies consisting of 265,941,382 people shows a poor negative correlation between the proportion of Serbians and percentage of population with at least doctorate degree education in the United States with a correlation coefficient (R) of -0.114 and weighted average of 2.0%, a difference of 56.2%.
Doctorate Degree Correlation Summary
| Measurement | Immigrants from Switzerland | Serbian |
| Minimum | 0.62% | 0.11% |
| Maximum | 11.8% | 4.5% |
| Range | 11.2% | 4.4% |
| Mean | 5.0% | 1.6% |
| Median | 4.2% | 1.4% |
| Interquartile 25% (IQ1) | 2.6% | 0.69% |
| Interquartile 75% (IQ3) | 8.0% | 1.9% |
| Interquartile Range (IQR) | 5.5% | 1.2% |
| Standard Deviation (Sample) | 3.3% | 1.1% |
| Standard Deviation (Population) | 3.2% | 1.1% |
Similar Demographics by Doctorate Degree
Demographics Similar to Immigrants from Switzerland by Doctorate Degree
In terms of doctorate degree, the demographic groups most similar to Immigrants from Switzerland are Immigrants from China (3.1%, a difference of 0.070%), Immigrants from Israel (3.0%, a difference of 1.4%), Iranian (3.1%, a difference of 1.9%), Immigrants from Iran (3.0%, a difference of 2.1%), and Immigrants from Taiwan (3.2%, a difference of 3.5%).
| Demographics | Rating | Rank | Doctorate Degree |
| Immigrants | Singapore | 100.0 /100 | #1 | Exceptional 3.7% |
| Filipinos | 100.0 /100 | #2 | Exceptional 3.4% |
| Okinawans | 100.0 /100 | #3 | Exceptional 3.3% |
| Immigrants | Taiwan | 100.0 /100 | #4 | Exceptional 3.2% |
| Iranians | 100.0 /100 | #5 | Exceptional 3.1% |
| Immigrants | Switzerland | 100.0 /100 | #6 | Exceptional 3.1% |
| Immigrants | China | 100.0 /100 | #7 | Exceptional 3.1% |
| Immigrants | Israel | 100.0 /100 | #8 | Exceptional 3.0% |
| Immigrants | Iran | 100.0 /100 | #9 | Exceptional 3.0% |
| Immigrants | Eastern Asia | 100.0 /100 | #10 | Exceptional 3.0% |
| Indians (Asian) | 100.0 /100 | #11 | Exceptional 2.9% |
| Immigrants | Belgium | 100.0 /100 | #12 | Exceptional 2.9% |
| Immigrants | Sweden | 100.0 /100 | #13 | Exceptional 2.9% |
| Immigrants | France | 100.0 /100 | #14 | Exceptional 2.9% |
| Immigrants | India | 100.0 /100 | #15 | Exceptional 2.8% |
Demographics Similar to Serbians by Doctorate Degree
In terms of doctorate degree, the demographic groups most similar to Serbians are Immigrants from Cameroon (2.0%, a difference of 0.060%), Swedish (2.0%, a difference of 0.14%), South American Indian (2.0%, a difference of 0.15%), Immigrants from Uzbekistan (2.0%, a difference of 0.21%), and Swiss (2.0%, a difference of 0.24%).
| Demographics | Rating | Rank | Doctorate Degree |
| Immigrants | Zaire | 91.1 /100 | #128 | Exceptional 2.0% |
| Canadians | 90.6 /100 | #129 | Exceptional 2.0% |
| Immigrants | Ukraine | 90.5 /100 | #130 | Exceptional 2.0% |
| Immigrants | Sierra Leone | 90.2 /100 | #131 | Exceptional 2.0% |
| Scottish | 89.4 /100 | #132 | Excellent 2.0% |
| Immigrants | Uzbekistan | 89.3 /100 | #133 | Excellent 2.0% |
| Immigrants | Cameroon | 88.9 /100 | #134 | Excellent 2.0% |
| Serbians | 88.7 /100 | #135 | Excellent 2.0% |
| Swedes | 88.3 /100 | #136 | Excellent 2.0% |
| South American Indians | 88.3 /100 | #137 | Excellent 2.0% |
| Swiss | 88.0 /100 | #138 | Excellent 2.0% |
| Afghans | 87.2 /100 | #139 | Excellent 2.0% |
| Immigrants | Africa | 87.0 /100 | #140 | Excellent 2.0% |
| Senegalese | 86.7 /100 | #141 | Excellent 2.0% |
| Italians | 86.0 /100 | #142 | Excellent 2.0% |