French American Indian vs Japanese 10th Grade
COMPARE
French American Indian
Japanese
10th Grade
10th Grade Comparison
French American Indians
Japanese
93.7%
10TH GRADE
50.9/ 100
METRIC RATING
172nd/ 347
METRIC RANK
91.2%
10TH GRADE
0.0/ 100
METRIC RATING
301st/ 347
METRIC RANK
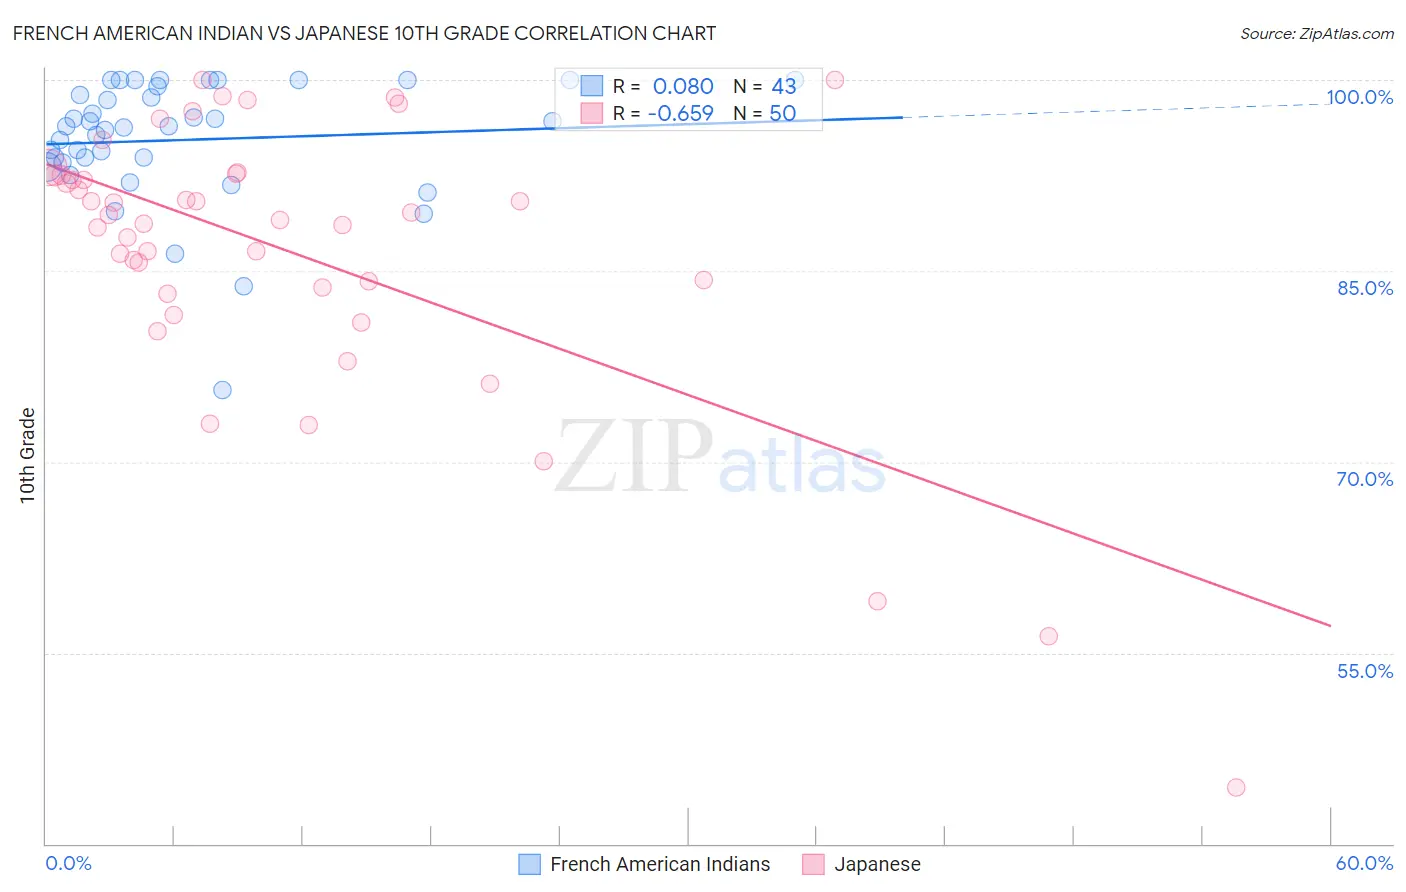
French American Indian vs Japanese 10th Grade Correlation Chart
The statistical analysis conducted on geographies consisting of 131,976,269 people shows a slight positive correlation between the proportion of French American Indians and percentage of population with at least 10th grade education in the United States with a correlation coefficient (R) of 0.080 and weighted average of 93.7%. Similarly, the statistical analysis conducted on geographies consisting of 249,183,224 people shows a significant negative correlation between the proportion of Japanese and percentage of population with at least 10th grade education in the United States with a correlation coefficient (R) of -0.659 and weighted average of 91.2%, a difference of 2.8%.
10th Grade Correlation Summary
| Measurement | French American Indian | Japanese |
| Minimum | 75.6% | 44.4% |
| Maximum | 100.0% | 100.0% |
| Range | 24.4% | 55.6% |
| Mean | 95.3% | 86.5% |
| Median | 96.3% | 89.2% |
| Interquartile 25% (IQ1) | 93.5% | 83.7% |
| Interquartile 75% (IQ3) | 99.6% | 92.6% |
| Interquartile Range (IQR) | 6.1% | 8.9% |
| Standard Deviation (Sample) | 4.9% | 11.1% |
| Standard Deviation (Population) | 4.9% | 11.0% |
Similar Demographics by 10th Grade
Demographics Similar to French American Indians by 10th Grade
In terms of 10th grade, the demographic groups most similar to French American Indians are Immigrants from Albania (93.8%, a difference of 0.010%), Spaniard (93.7%, a difference of 0.010%), Argentinean (93.7%, a difference of 0.010%), Immigrants from Nepal (93.7%, a difference of 0.010%), and Immigrants from Venezuela (93.8%, a difference of 0.030%).
| Demographics | Rating | Rank | 10th Grade |
| Brazilians | 63.6 /100 | #165 | Good 93.8% |
| Immigrants | Iraq | 63.0 /100 | #166 | Good 93.8% |
| Immigrants | Egypt | 62.3 /100 | #167 | Good 93.8% |
| Alsatians | 59.4 /100 | #168 | Average 93.8% |
| Immigrants | Spain | 55.9 /100 | #169 | Average 93.8% |
| Immigrants | Venezuela | 53.9 /100 | #170 | Average 93.8% |
| Immigrants | Albania | 52.4 /100 | #171 | Average 93.8% |
| French American Indians | 50.9 /100 | #172 | Average 93.7% |
| Spaniards | 50.3 /100 | #173 | Average 93.7% |
| Argentineans | 50.0 /100 | #174 | Average 93.7% |
| Immigrants | Nepal | 49.6 /100 | #175 | Average 93.7% |
| Immigrants | Argentina | 47.1 /100 | #176 | Average 93.7% |
| Immigrants | Lebanon | 47.1 /100 | #177 | Average 93.7% |
| Sierra Leoneans | 46.1 /100 | #178 | Average 93.7% |
| Paraguayans | 45.3 /100 | #179 | Average 93.7% |
Demographics Similar to Japanese by 10th Grade
In terms of 10th grade, the demographic groups most similar to Japanese are Immigrants from Guyana (91.2%, a difference of 0.010%), Immigrants from Vietnam (91.2%, a difference of 0.030%), Pima (91.2%, a difference of 0.080%), Immigrants from Dominica (91.1%, a difference of 0.10%), and Guyanese (91.4%, a difference of 0.15%).
| Demographics | Rating | Rank | 10th Grade |
| Haitians | 0.0 /100 | #294 | Tragic 91.8% |
| Lumbee | 0.0 /100 | #295 | Tragic 91.7% |
| Immigrants | Grenada | 0.0 /100 | #296 | Tragic 91.6% |
| Fijians | 0.0 /100 | #297 | Tragic 91.5% |
| Cubans | 0.0 /100 | #298 | Tragic 91.5% |
| Immigrants | Haiti | 0.0 /100 | #299 | Tragic 91.4% |
| Guyanese | 0.0 /100 | #300 | Tragic 91.4% |
| Japanese | 0.0 /100 | #301 | Tragic 91.2% |
| Immigrants | Guyana | 0.0 /100 | #302 | Tragic 91.2% |
| Immigrants | Vietnam | 0.0 /100 | #303 | Tragic 91.2% |
| Pima | 0.0 /100 | #304 | Tragic 91.2% |
| Immigrants | Dominica | 0.0 /100 | #305 | Tragic 91.1% |
| Yaqui | 0.0 /100 | #306 | Tragic 91.1% |
| Immigrants | Fiji | 0.0 /100 | #307 | Tragic 91.0% |
| Immigrants | Bangladesh | 0.0 /100 | #308 | Tragic 91.0% |