Scandinavian vs Bolivian 7th Grade
COMPARE
Scandinavian
Bolivian
7th Grade
7th Grade Comparison
Scandinavians
Bolivians
97.4%
7TH GRADE
100.0/ 100
METRIC RATING
29th/ 347
METRIC RANK
95.4%
7TH GRADE
1.1/ 100
METRIC RATING
249th/ 347
METRIC RANK
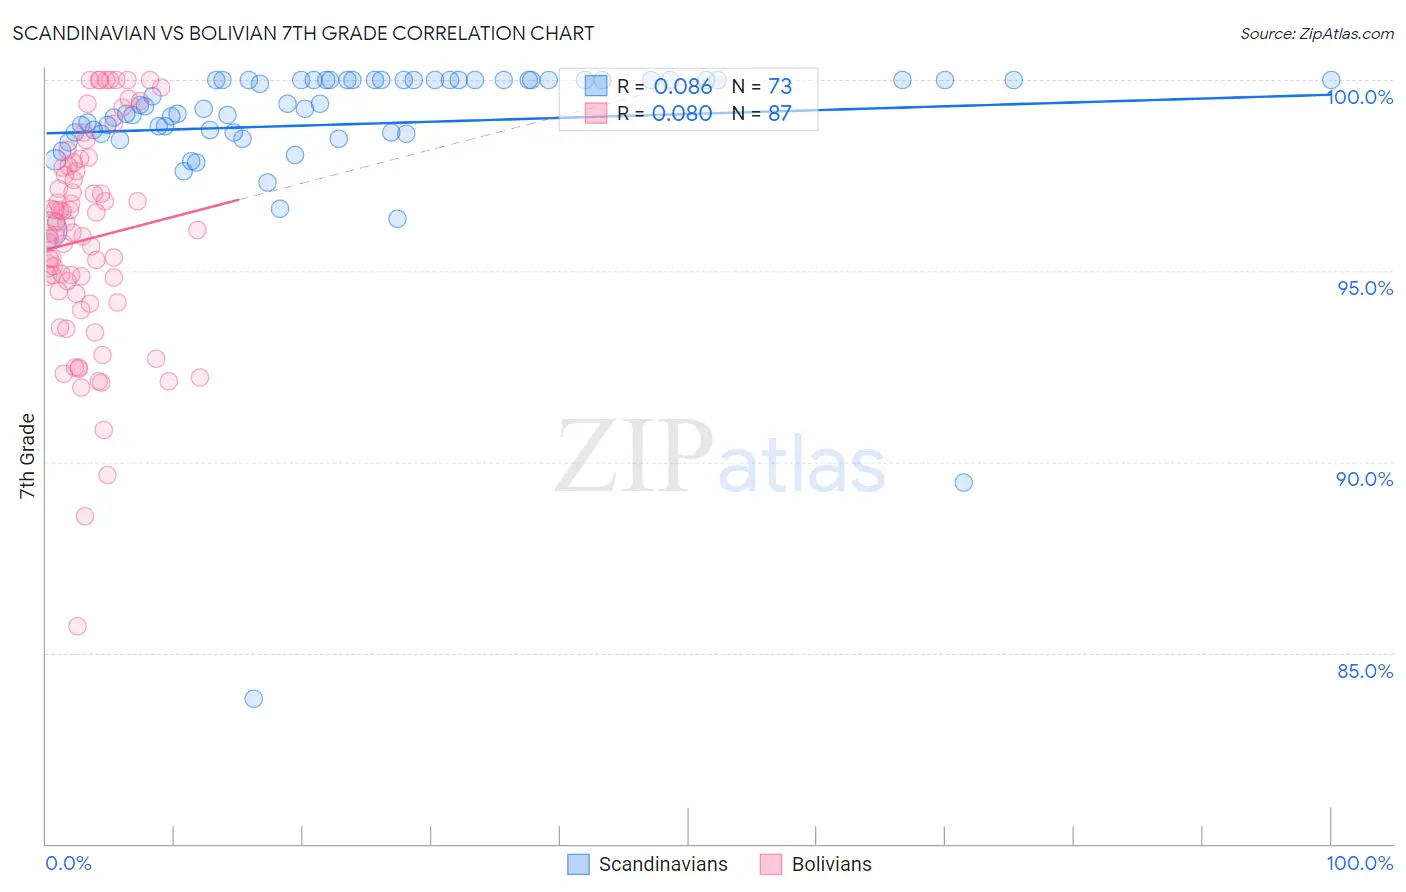
Scandinavian vs Bolivian 7th Grade Correlation Chart
The statistical analysis conducted on geographies consisting of 472,660,435 people shows a slight positive correlation between the proportion of Scandinavians and percentage of population with at least 7th grade education in the United States with a correlation coefficient (R) of 0.086 and weighted average of 97.4%. Similarly, the statistical analysis conducted on geographies consisting of 184,666,822 people shows a slight positive correlation between the proportion of Bolivians and percentage of population with at least 7th grade education in the United States with a correlation coefficient (R) of 0.080 and weighted average of 95.4%, a difference of 2.1%.
7th Grade Correlation Summary
| Measurement | Scandinavian | Bolivian |
| Minimum | 83.8% | 85.7% |
| Maximum | 100.0% | 100.0% |
| Range | 16.2% | 14.3% |
| Mean | 98.8% | 95.8% |
| Median | 99.3% | 96.0% |
| Interquartile 25% (IQ1) | 98.6% | 94.4% |
| Interquartile 75% (IQ3) | 100.0% | 97.7% |
| Interquartile Range (IQR) | 1.4% | 3.3% |
| Standard Deviation (Sample) | 2.3% | 2.8% |
| Standard Deviation (Population) | 2.3% | 2.8% |
Similar Demographics by 7th Grade
Demographics Similar to Scandinavians by 7th Grade
In terms of 7th grade, the demographic groups most similar to Scandinavians are Sioux (97.4%, a difference of 0.0%), Czech (97.4%, a difference of 0.010%), French (97.4%, a difference of 0.030%), Scotch-Irish (97.4%, a difference of 0.030%), and Danish (97.4%, a difference of 0.030%).
| Demographics | Rating | Rank | 7th Grade |
| French Canadians | 100.0 /100 | #22 | Exceptional 97.4% |
| Croatians | 100.0 /100 | #23 | Exceptional 97.4% |
| Welsh | 100.0 /100 | #24 | Exceptional 97.4% |
| French | 100.0 /100 | #25 | Exceptional 97.4% |
| Scotch-Irish | 100.0 /100 | #26 | Exceptional 97.4% |
| Danes | 100.0 /100 | #27 | Exceptional 97.4% |
| Sioux | 100.0 /100 | #28 | Exceptional 97.4% |
| Scandinavians | 100.0 /100 | #29 | Exceptional 97.4% |
| Czechs | 100.0 /100 | #30 | Exceptional 97.4% |
| Europeans | 100.0 /100 | #31 | Exceptional 97.3% |
| Italians | 100.0 /100 | #32 | Exceptional 97.3% |
| Chippewa | 100.0 /100 | #33 | Exceptional 97.3% |
| Alaska Natives | 100.0 /100 | #34 | Exceptional 97.3% |
| Swiss | 100.0 /100 | #35 | Exceptional 97.3% |
| Hungarians | 100.0 /100 | #36 | Exceptional 97.2% |
Demographics Similar to Bolivians by 7th Grade
In terms of 7th grade, the demographic groups most similar to Bolivians are Paiute (95.4%, a difference of 0.010%), Immigrants from Cameroon (95.4%, a difference of 0.020%), Immigrants from Jamaica (95.4%, a difference of 0.020%), Tongan (95.4%, a difference of 0.030%), and Immigrants from Ethiopia (95.3%, a difference of 0.030%).
| Demographics | Rating | Rank | 7th Grade |
| Immigrants | Senegal | 1.9 /100 | #242 | Tragic 95.5% |
| U.S. Virgin Islanders | 1.6 /100 | #243 | Tragic 95.4% |
| Uruguayans | 1.6 /100 | #244 | Tragic 95.4% |
| Immigrants | Middle Africa | 1.5 /100 | #245 | Tragic 95.4% |
| Ethiopians | 1.5 /100 | #246 | Tragic 95.4% |
| Tongans | 1.3 /100 | #247 | Tragic 95.4% |
| Paiute | 1.2 /100 | #248 | Tragic 95.4% |
| Bolivians | 1.1 /100 | #249 | Tragic 95.4% |
| Immigrants | Cameroon | 0.9 /100 | #250 | Tragic 95.4% |
| Immigrants | Jamaica | 0.9 /100 | #251 | Tragic 95.4% |
| Immigrants | Ethiopia | 0.9 /100 | #252 | Tragic 95.3% |
| Somalis | 0.9 /100 | #253 | Tragic 95.3% |
| Colombians | 0.8 /100 | #254 | Tragic 95.3% |
| Koreans | 0.8 /100 | #255 | Tragic 95.3% |
| Immigrants | China | 0.7 /100 | #256 | Tragic 95.3% |